Toggle navigation
Home
Article Category
Question Papers
General Knowlege
Popular Pages
Multiple Choice Question in
Multiple Choice Question in 049
Multiple Choice Question in 2016
Multiple Choice Question in -current-affairs-2016
Multiple Choice Question in TRADES-INSTRUCTOR---GR-II---SMITHY---TECHNICAL-EDUCATION
Question Answer in ASSISTANT-PROFESSOR---COMPUTER-SCIENCE-AND-ENGINEERING---TECHNICAL-EDUCATION
Multiple Choice Question in ASSISTANT-PROFESSOR---COMPUTER-SCIENCE-AND-ENGINEERING---TECHNICAL-EDUCATION
Multiple Choice Question in english
Multiple Choice Question in abbreviations-abbreviations-m
Multiple Choice Question in SSC CHSL 7 March 2018 Morning Shift
Multiple Choice Question in 072/2016
Question Answer Bank
Multiple Choice Question Bank
Question Answer Category
Multiple Choice Question Category
Home
->
Multiple Choice Questions
1. What is the percentage increase in total number of households for the northern region (upper-middle class) over the given period?
(A): 100%
(B): 200%
(C): 240%
(D): Cannot be determined
Previous Question
Show Answer
Next Question
Add Tags
Report Error
Show Marks
Write Comment
Type in
(Press Ctrl+g to toggle between English and the chosen language)
Post reply
Comments
Tags
CAT 1998
Show Similar Question And Answers
QA->There are 50 students in a class. In a class test 22 students get 25 marks each, 18 students get 30 marks each. Each of the remaining gets 16 marks. The average mark of the whole class is :....
QA->In a class of 20 students the average age is 16 years.If the age of the class teacher is added to that of students,the average age of the class becomes 17 years.What is the age of the teacher?....
QA->In a class of 60 students, 55% are boys. The number of girls in the class is :....
QA->If an officer is appointed to hold full charge of another post in addition to his own, he will be eligible for special allowance as a percentage of the minimum of the scale of pay of that post. This percentage shall not exceed:....
QA->If an officer is appointed to discharge the current duties of another post in addition to his own, he will be eligible for a special allowance as a percentage of the minimum of the scale of pay of the additional post. This percentage shall not exceed:....
MCQ-> Read the following passage carefully and answer the questions based on it. Some words have been printed in bold to help you locate them while answering some of the questions.Notwithstanding the fact that the share of household savings to GDS is showing decline, still this segment is the significant contributor to GDS with 70% share. Indian households are among the most frugal in the world However,
commensurate
capital formation has not been taking place as a lion's share of household savings are being parked in physical assets compared to financial assets. The pattern of disposition of saving is an important factor in determining how the saved amount is utilized for productive purposes. The proportion of household saving in financial assets determines the channelisation of saving for investment in other sectors of the economy. However, the volume of investment of saving in physical assets determines the productivity and generation of income in that sector itself. Post-Independence era has witnessed a significant shift in deployment of household savings especially the share of financial assets increased from 26.39% in 1950 to 54.05% in 1990 may be on account of increased bank branch network across the country coupled with improved awareness of investors on various financial / banking products. However, contrast to common expectations, the share of financial assets in total household savings has come down from 54.05% to 50.21% especially in post reform period i.e. 1990 to 2010 despite providing easy access and availability of banking facilities compared to earlier years. The increased share of physical assets over financial assets (around 4%) during the last two decades is a cause of concern requires focused attention to arrest the trend. Traditionally, the Indians are risk-averse and prefer to invest surplus funds in physical assets such as Gold, Silver and lands. Nevertheless, considerable share of savings also owing to financial assets, which includes, Currency, Bank Deposits, Claims on Government,
Contractual
Savings, Equities The composition of household financial savings shows that the bank deposits (44%) continue to remain the major contributor along with the rise in the Contractual Savings, Claims on Government and Currency. Though there was gradual decline in currency holdings by the households i.e. 13.79% in 1970s to 9.30% in 2007, still the present currency holding level with households appears to be on high side compared to other countries. The primary reasons for higher currency holdings could be absence of banking facilities in majority villages (5.70 lakh villages)as well as hoarding of unaccounted money in the form of cash to circumvent tax laws. Though, cash is treated as financial asset, in reality, a major portion of currency is blocked and become unproductive. Bank deposits seemed to be the preferred choice mainly on account of its inbuilt features such as Safety, Security and Liquidity. Traditionally, the Household sector has been playing a leading role in the landscape of bank deposits followed by the Government sector. However, the last two decades has witnessed significant shift in ownership of Bank deposits. While there was improvement in Corporate and Government sectors' share by 8.30% and 7.20% respectively during the period 1999 to 2009, household sector lost a share of 13.30% in the post reform period. In the post independence era, Indian financial system was characterized by poor infrastructure and low level of financial deepening. Savings in physical assets constituted the largest portion of the savings compared to the financial assets in the initial years of the planning periods. While rural households were keen on acquiring farm assets, the portfolio of urban households constituted consumer durables, gold, jewellery and house property.Despite the fact that the household savings have been gradually moving from physical assets to financial assets over the years, still 49.79% of household savings are wrapped in unproductive physical assets, which is a cause of concern as the share of physical assets to total savings are very high in the recent years compared to emerging economies. This trend needs to be arrested as scarce funds are being diverted into unproductive segments. Of course, investment in Real estate sector can be treated as productive provided construction activity is commenced within reasonable time, but it is regrettably note that many investors just buy and hold it for speculation leading to unproductive investments. India has probably the largest fascination with gold than any other country in the world with a share of 9.50% of the world's total gold holdings. The World Gold Council believes that they are over 18000 tonnes of gold holding in the country. More impressive is the fact that current demand from India alone consumes 25% of the world's annual gold output. Large amount of capital is blocked in gold which resides in bank lockers and remain unproductive. Indian economy would grow faster if the capital markets could attract more of the nation's savings and channel them into more productive areas, especially infrastructure. If the Indian market can develop and evolve into a more mature financial system, which persuades the middle class to put more of its money into equities, the potential is
mind-boggling.
Which of the following statement (s) is/are correct in the context of the given passage? I. The GDS percentage to GDP has shown considerable improvement from 10% in 1950 to 33.7% in 2010, which is one of the highest globally. II. The saving rate however shows an increasing trend, marginal decline is observed under tic use hold sector. III. The share of financial assets in total household savings have come down from 54.05% to 21% especially in post reform era.....
MCQ-> Answer the questions based on the following information. The following bar chart gives the growth percentage in the number of households in the middle, upper-middle and high-income categories in the four regions for the period between 1987-88 and 1994-95.
(Number of households in thousands)Which region showed the highest percentage growth in number of households in all the income categories for the period?
....
MCQ->What is the percentage increase in total number of households for the northern region (upper-middle class) over the given period?....
MCQ-> Read the following passage carefully and answer the questions. Certain words/ phrases are given in bold to help you locate them while ‘answering some of the questions. Inequality is at the top of the agenda around the world. Hilary Clinton, the leading Democratic candidate to succeed Barack Obama as president of the United. States, made inequality the centrepiece of a major campaign speech. Economists at the IMF too have recently released a study assessing the causes and consequences of rising inequality. Its authors reckon that while inequality could cause all sorts of problems, governments should be especially concerned about its effects on growth. They estimate that a one percentage .point increase in the income share of the top 20% will drag down growth by 0.08% percentage points over five years, while a rise in the income share of the bottom 20% actually boosts growth. But how does inequality affect economic growth rates? Economists say that some inequality is needed to propel growth. Without the
carrot
of large financial rewards, risky entrepreneurship and innovation would grind to a halt. In 1975, an American economist, argued that societies cannot have both perfect equality and perfect efficiency, but must choose how much of one to sacrifice for the other. While most economists continue to hold that view, the recent rise in inequality has prompted a new look at its economic costs. Inequality could impair growth if those with low incomes suffer poor health and low productivity as a result, or if, as evidence suggests, the poor struggle to finance investments in education, inequality could also threaten public confidence in growth-boosting capitalist strategies like
free
trade. More recent work suggests that inequality, could lead to economic or financial instability. The governor of the Reserve Bank of India argued that governments often respond to inequality by easing the flow of credit to poorer households, howe+er, American households borrowed heavily prior to the crisis to prop up their consumption. But for this rise in household debt, consumption would have stagnated as a result of poor wage growth. Crafting a response to rising inequality is therefore tricky, he says. Some of the negative impact of inequality on growth can be blamed on poor government policies in highly unequal countries. In Latin America, for instance, populist pressure for excessive state economic control seems to shorten the average duration of growth
spells.
Yet in moderation, redistribution seems to
benign
effects-perhaps by reducing dependence on risky borrowing among poorer households. Over the past generation or two inequality has risen most in places where progressive policies, such as high top tax-rates, have been weakened. A little more redistribution now might improve the quality and quantity of economic-growth and reduce the demand for more aggressive state interventions later.Choose the word which is most nearly the same in meaning to the word CARROT given in bold as used in the passage.
....
MCQ-> There are two Trains, Train-A and Train-B. Both Trains have four different types of Coaches viz. General Coaches, Sleeper Coaches, First Class Coaches and AC Coaches. In Train A there are total 700 passengers. Train-B has thirty percent more passengers than Train A. Twenty percent of the passengers of Train-A are in General Coaches. One-fourth of the total number of passengers of Train-A are in AC coaches. Twenty three percent of the passengers of Train-A are in Sleeper Class Coaches. Remaining passengers of Train-A are in first class coaches. Total number of passengers in AC coaches in both the trains together is 480. Thirty percent of the number of passengers of Train-B is in Sleeper Class Coaches. Ten percent of the total passengers of Train-B are in first class coaches. Remaining passengers of Train-B are in general class coaches.What is the respective ratio between the number of passengers in first class Coaches of Train A and number of passengers in Sleeper Class coaches of Train - B ?
....
×
×
Type The Issue
×
Your Marks
Terms And Service:We do not guarantee the accuracy of available data ..We Provide Information On Public Data.. Please consult an expert before using this data for commercial or personal use
Powered By:Omega Web Solutions
© 2002-2017 Omega Education PVT LTD...
Privacy
|
Terms And Conditions
 Powered By:Omega Web Solutions
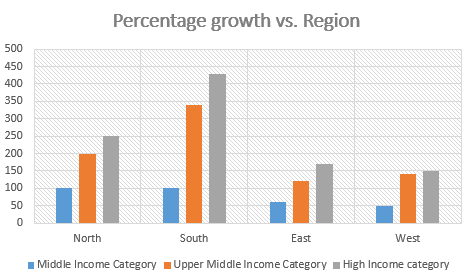
 (Number of households in thousands)Which region showed the highest percentage growth in number of households in all the income categories for the period?