1.
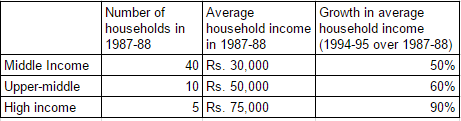
Answer the questions based on the following information. The following bar chart gives the growth percentage in the number of households in the middle, upper-middle and high-income categories in the four regions for the period between 1987-88 and 1994-95. 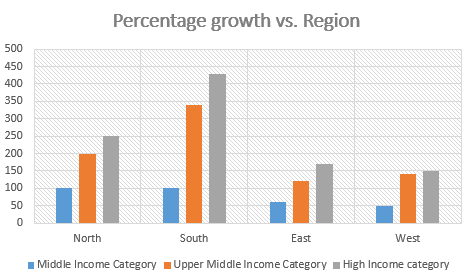
 (Number of households in thousands)Which region showed the highest percentage growth in number of households in all the income categories for the period?
Write Comment
Comments
- By: anil on 05 May 2019 02.31 amPercentage growth of all households South region showed the maximum increase in all households in the given period. (100% + 340%+ 425% = 865%)
Show Similar Question And Answers
