1.
The line graph shows the number of students who passed with distinction in the given year from a certain university. Study the diagram and answer the following questions.
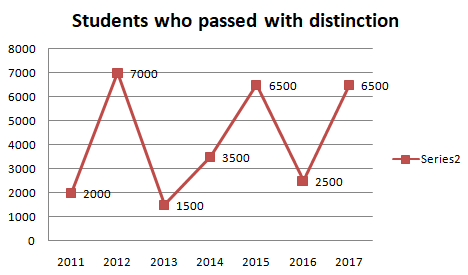 YearIn which year were number of students who passed with distinction were lesser than those who passed in the previous year?
Write Comment
Comments
- By: anil on 05 May 2019 02.06 amIn 2013 and 2016, the number of students who passed with distinction were lesser than those who passed in the previous year. => Ans - (D)
Show Similar Question And Answers
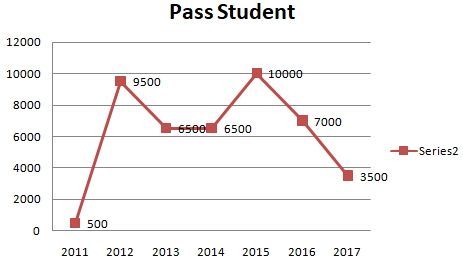 YearIn which year were number of students who passed were more than those who passed in the previous year?
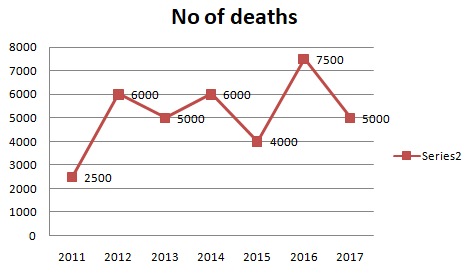 YearIn which year were the number of deaths lesser than that of the previous year?