1. 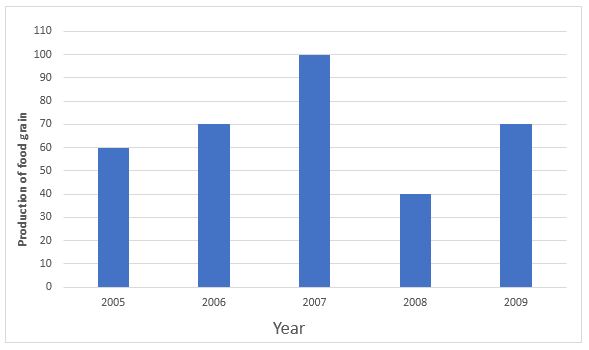 Study the above bar graph showing the production of food grains (in million tons). What is the ratio between the maximum production and the minimum production during the given period ?
Graph should be drawn
Study the above bar graph showing the production of food grains (in million tons). What is the ratio between the maximum production and the minimum production during the given period ?
Graph should be drawn
Write Comment
Comments
- By: anil on 05 May 2019 01.55 am
Show Similar Question And Answers

While in the year 2008 , minimum production of 40 mil tonnes is observed.
Hence , the ratio is 100:40 = 5:2