Write Comment
Comments
- By: anil on 05 May 2019 01.53 amThe Cumulative frequency curve for a grouped frequency distribution is obtained by plotting the points and then joining them by a free-hand smooth curve. This is also known as ogive. Ans - (D)
Show Similar Question And Answers
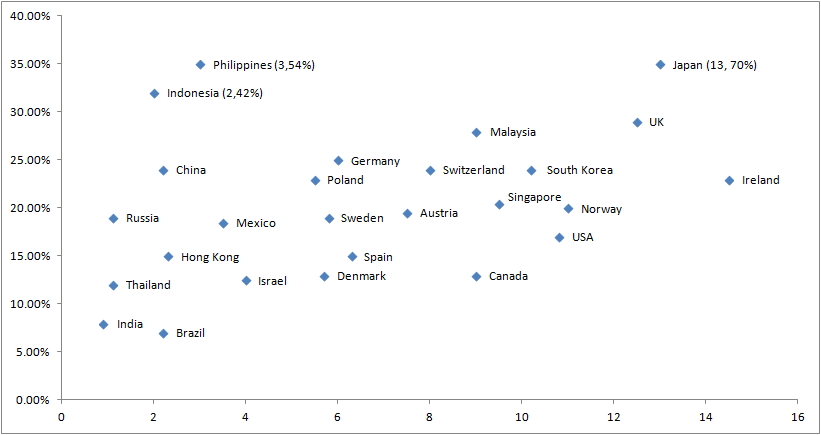 It was found that the volume of data transfer in India is the same as that of Singapore. Then which of the following statements is true?