IIFT2010QuestionPaper Related Question Answers
51.
The table below represents the information collected by TRAI about the Service Area wise Access of (Wireless + Wire line) subscribers in India. On the basis of the information provided in the table answer the questions that follow.
 Which service area has observed maximum rate of change from Dec 2009 to March 2010 (in percentage)?
52. As a result of a decisions to allow only two or three telecom operator in a particular service area, TRAI allocates R-Com and Vodafone to operate only in the east of India and Idea and Airtel operate only in south. R-Com has got 28% subscribers in the east while Vodafone has 72% subscribers; similarly Idea has 48% subscribers in the south while Airtel has 52% subscribers. How many subscribers do these four players have in 2010?
53. Due to operability issues early in 2010 Madhya Pradesh and entire UP was added to the eastern telecom circle. The telecom operators in Madhya Pradesh and entire UP namely R-Com, Vodafone and Idea had 28%, 40% and 32% subscribers respectively. What is the percentage of subscribers that each player has in the newly formed eastern circle in March 2010?
55.
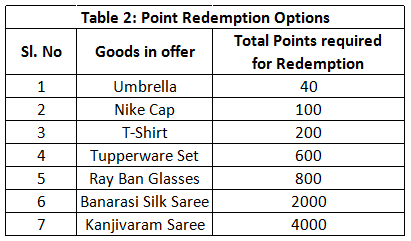
In order to quantify the intangibles and incentives to the multi brand dealers (dealers who stock multiple goods as well as competing brands) and the associated channel members, a Company(X) formulates a point score card, which is called as brand building points. This brand building point is added to the sales target achieved points for redemption. The sales target achieved point is allotted as per the table 3 of this question. The sum of brand building point and sales achieved points is the total point that can be redeemed by the dealer against certain goods, as shown in the second table.
The detail of the system is shown in the tables below

 There are 10 multi brand dealers in Nasik and the sales that they have achieved in the end of a quarter are:
 Maheshwari & Co has Company X signage along with other brand signage in the main entrance of the store, the exterior walls of the store have the painting of only company X, the side wall in the interior has the painting of Company X. The POP display of Company X is above the eye level with other brands while the stacking of goods of Company X is in the back row of the shelves. The brand building points when combined with the sales achieved points amounts to the total points that a dealer can accumulate in a quarter. The number of Tupperware Sets that Maheshwari & Co can redeem after the quarter (July to September) is?
56. Bhowmik Brothers has only other brands signage in the front of the store, and company X painting on the side wall in the exterior of the store, Company X painting on the side wall in the interior of the store, no POP display of any Company and the goods of Company X is stacked in the front row with other brands. What is the total point Bhowmik Brothers need to accumulate to make them eligible for minimum redemption?
57. The Brand building points of Saha H/W is 85, and Mr. Saha the proprietor of the store wants to redeem a Kanjivaram Saree the next quarter by carrying forward the points accumulated this quarter to the next quarter. The sales target of Saha H/W is 25,000 units in the next quarter. It is assumed the brand building points for the next quarter is also going to be 85. How many extra units Saha H/W has to sell in order to get the Kanjivaram Saree?
58. Malling Enterprise exhausted all its points while redeeming three Nike Caps and an Umbrella, what is its brand building points?
59. If Srikrishna Trader has 80 brand building points then the goods that it can redeem are _________?
60.
Study the following graph and answer the questions that follow
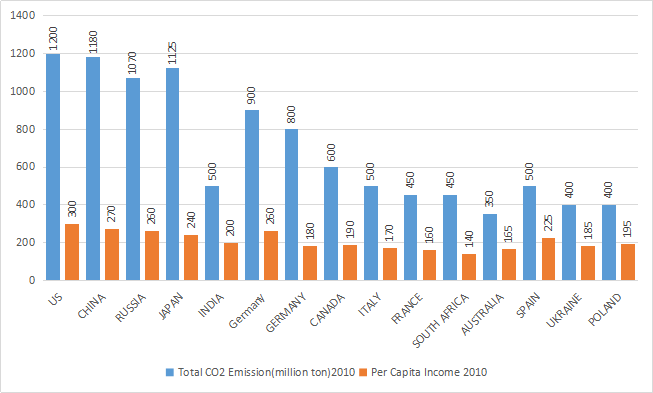 If the world energy council formulates a norm for high emission countries to reduce their emission each year by 12.5% for the next two years then what would be the ratio of $$CO_2$$ emission to per capita income of US, China and Japan after two years. The per capita income of China, Japan and US is expected to increase every year by 4%, 3% and 2% respectively.
61.
Study the following graph and answer the questions that follow
If US and China, decide to buy carbon credits, from Spain and Ukraine to make up for their high emissions, then in how many years US, and China would be able to bring down its ratio of $$CO_2$$ emission (million ton) to per capita income to world standard benchmark of 0.75. (per capita income of the given countries remain same, 0.5 $$CO_2$$ emissions [million ton] is compensated by purchase of 1.25 units of carbon credit, and a country can buy carbon credit units in three lots of 15, 20 and 30 units in a single year.)
62.
Study the following graph and answer the questions that follow
France, South Africa, Australia, Ukraine and Poland form an energy consortium which declares $$CO_2$$ emission of 350 million ton per annum as standard benchmark. The energy consortium decides to sell their carbon emission savings against the standard benchmark to high carbon emission countries. It is expected that the per capita income of each country of the energy consortium increases by 2%, 2.5% and 3.5% p.a. for the next three years respectively. The ratio of $$CO_2$$ emission to per capita income of the each energy consortium country reduces by 50% and remains constant for the next three years. By selling 0.5 $$CO_2$$ emissions [million ton] the energy consortium earns 1.25 carbon credits, then determine the total carbon credits earned by energy consortium in three years.
63.
Study the following graph and answer the questions that follow
Select the wrong statement in reference to the position of India vis-à-vis other countries in the graph in terms of the ratio of $$CO_2$$ emission to per capita income (increasing order).
64.
Refer to the following pie chart and answer the question that follows. The chart shows the number of units produced in degrees, by Company X in different States of India for the quarter July-Sep 2010.
 By how many units does the number of units produced in Bihar exceed the number of units produced in Madhya Pradesh, if the total production in the quarter is 72, 000 units?
65.
The following graph shows population data (males and females), educated people data (males and females) and number of male in the population for a given period of 1995 to 2010. All data is in million.From the information given in the graph answer the questions that follow
 In which year the percentage increase in the number of females over the previous year is highest?
66. In 2002 if the ratio of number of educated male to professionally educated female was 5:4. If the number of educated males increased by 25% in 2003. What is the percentage change in number of uneducated females in 2003?
67. In year 2005 total population living in urban area is equal to sixty eight percent of educated population. The ratio of number of people living in urban area to people living in rural area is 43:12 in 2010. What is the ratio of the rural population in 2005 to that in 2010?
68. As per the passage which of the following statements truly reflects the real theme of' the passage?
69. Which of the following statements is not true? I. Kodak bought sterling drug as a strategic choice for a chemical business as it was already in the business of chemically treated photo paper. II. The chemical business was in sync with the existing business of Kodak running across the customer segment, delivery channels and the regulatory environment. III. Kodak committed a mistake by selling sterling in pieces at a loss of 50%. IV. Kodak’s diversification attempt with purchase of sterling to strengthen its core business and shift to digital world was a shift from its strategic focus.
70. Kodak lost a big piece of its market share to its competitors because of the following best explained reason. I. When Carp became the CEO the digital Technology eclipsed film technology business and further Carp had been with the company for twenty nine years and had no background in technology. II. Carp in 2004 introduced a film camera that won camera of the year award, yet it was discontinued by the time Kodak collected the award. III. Kodak moved from traditional retail photo processing systems into digital world installing several thousands of image magic kiosks that failed to deliver real benefits to the customers. IV. Phillipe Kahn led the advent of cell phone camera and Kodak lost out on the print business and ability to share images became a free feature with no additional charge.
71. Arrange the given statements in the correct sequence as they appear in the passage. I. Kodak lost to its competitors a big pie of its market share. II. Kodak ventured into chemical business to strengthen its digital technology business. III. Kodak downsized its workforce drastically. IV. Kodak tied up with business firms for photo processing.

73. People are continually enticed by such "hot" performance, even if it lasts for brief periods. Because of this susceptibility, brokers or analysts who have had one or two stocks move up sharply, or technicians who call one turn correctly, are believed to have established a credible record and can readily find market followings. Likewise, an advisory service that is right for a brief time can beat its drums loudly. Elaine Garzarelli gained near immortality when she purportedly "called" the 1987 crash. Although, as the market strategist for Shearson Lehman, her forecast was never published in a research report, nor indeed communicated to its clients, she still received widespread recognition and publicity for this call, which was made in a short TV interview on CNBC. Still, her remark on CNBC that the Dow could drop sharply from its then 5300 level rocked an already nervous market on July 23, 1996. What had been a 40-point gain for the Dow turned into a 40-point loss, a good deal of which was attributed to her comments.The truth is, market-letter writers have been wrong in their judgments far more often than they would like to remember. However, advisors understand that the public considers short-term results meaningful when they are, more often than not, simply chance. Those in the public eye usually gain large numbers of new subscribers for being right by random luck. Which brings us to another important probability error that falls under the broad rubric of representativeness. Amos Tversky and Daniel Kahneman call this one the "law of small numbers.". The statistically valid "law of large numbers" states that large samples will usually be highly representative of the population from which they are drawn; for example, public opinion polls are fairly accurate because they draw on large and representative groups. The smaller the sample used, however (or the shorter the record), the more likely the findings are chance rather than meaningful. Yet the Tversky and Kahneman study showed that typical psychological or educational experimenters gamble their research theories on samples so small that the results have a very high probability of being chance. This is the same as gambling on the single good call of an advisor. The psychologists and educators are far too confident in the significance of results based on a few observations or a short period of time, even though they are trained in statistical techniques and are aware of the dangers.Note how readily people over generalize the meaning of a small number of supporting facts. Limited statistical evidence seems to satisfy our intuition no matter how inadequate the depiction of reality. Sometimes the evidence we accept runs to the absurd. A good example of the major overemphasis on small numbers is the almost blind faith investors place in governmental economic releases on employment, industrial production, the consumer price index, the money supply, the leading economic indicators, etc. These statistics frequently trigger major stock- and bond-market reactions, particularly if the news is bad. Flash statistics, more times than not, are near worthless. Initial economic and Fed figures are revised significantly for weeks or months after their release, as new and "better" information flows in. Thus, an increase in the money supply can turn into a decrease, or a large drop in the leading indicators can change to a moderate increase. These revisions occur with such regularity you would think that investors, particularly pros, would treat them with the skepticism they deserve. Alas, the real world refuses to follow the textbooks. Experience notwithstanding, investors treat as gospel all authoritative-sounding releases that they think pinpoint the development of important trends. An example of how instant news threw investors into a tailspin occurred in July of 1996. Preliminary statistics indicated the economy was beginning to gain steam. The flash figures showed that GDP (gross domestic product) would rise at a 3% rate in the next several quarters, a rate higher than expected. Many people, convinced by these statistics that rising interest rates were imminent, bailed out of the stock market that month. To the end of that year, the GDP growth figures had been revised down significantly (unofficially, a minimum of a dozen times, and officially at least twice). The market rocketed ahead to new highs to August l997, but a lot of investors had retreated to the sidelines on the preliminary bad news. The advice of a world champion chess player when asked how to avoid making a bad move. His answer: "Sit on your hands”. But professional investors don't sit on their hands; they dance on tiptoe, ready to flit after the least particle of information as if it were a strongly documented trend. The law of small numbers, in such cases, results in decisions sometimes bordering on the inane. Tversky and Kahneman‘s findings, which have been repeatedly confirmed, are particularly important to our understanding of some stock market errors and lead to another rule that investors should follow.Which statement does not reflect the true essence of the passage? I. Tversky and Kahneman understood that small representative groups bias the research theories to generalize results that can be categorized as meaningful result and people simplify the real impact of passable portray of reality by small number of supporting facts. II. Governmental economic releases on macroeconomic indicators fetch blind faith from investors who appropriately discount these announcements which are ideally reflected in the stock and bond market prices. III. Investors take into consideration myopic gain and make it meaningful investment choice and fail to see it as a chance of occurrence. IV. lrrational overreaction to key regulators expressions is same as intuitive statistician stumbling disastrously when unable to sustain spectacular performance.
74. The author of the passage suggests the anomaly that leads to systematic errors in predicting future. Which of the following statements does not best describe the anomaly as suggested in the passage above? I. The psychological pressures account for the anomalies just like soothsayers warning about the doomsday and natural disasters and market crashes. II. Contrary to several economic and financial theories investors are not good intuitive statistician, especially under difficult conditions and are unable to calculate the odds properly when making investments choices. III. Investors are swamped with information and they react to this avalanche of data by adopting shortcuts or rules of thumb rather than formally calculating odds of a given outcome. IV. The distortions produced by subjectively calculated probabilities are large, systematic and difficult to eliminate even when investors are fully aware of them.
75. “Tversky and Kahneman’s findings ... lead to another rule that investors should follow”. Which rule is the author talking about? I. Not to be influenced by short term and occasional record of a money manager, broker, analysts, or advisor, no matter how impressive. II. To accept cursory economic or investment news without significant substantiation but supported by statistical evidence even if limited in data sufficiency. III. In making decisions we become overly immersed in the details of a particular situation and consider all the outcomes of similar experience in our past. IV. None of the above.
 Powered By:Omega Web Solutions
© 2002-2017 Omega Education PVT LTD...Privacy | Terms And Conditions