1. In year 2005 total population living in urban area is equal to sixty eight percent of educated population. The ratio of number of people living in urban area to people living in rural area is 43:12 in 2010. What is the ratio of the rural population in 2005 to that in 2010?


Write Comment

Type in
(Press Ctrl+g to toggle between English and the chosen language)

Comments

Show Similar Question And Answers
QA->Which country’s expertise in urban planning will be utilized in the Urban Management Programme that was launched by NITI Aayog on 27 April 2016 to build thecapacities of State Governments and Urban Local Bodies?....
QA->IndianRailways recently set the target to achieve 100 percent de-carbonisation with90 percent electrification by which year?....
QA->The three-fifth of a number is 40 more than the 40 percent of the same number. The number is :....
QA->Sixty years after it first went to court, which high court has recently pronounced judgment in the Ayodhya dispute, a political, historical and socio-religious debate in India?....
QA->The ratio of the inertial mass to gravitational mass is equal to which number?....
MCQ-> Read the following passages carefully and answer the questions given at the end of each passage.PASSAGE 3Typically women participate in the labour force at a very high rate in poor rural countries. The participation rate then falls as countries industrialise and move into the middle income class. Finally, if the country grows richer still, more families have the resources for higher education for women and from there they often enter the labour force in large numbers. Usually, economic growth goes hand in hand with emancipation of women. Among rich countries according to a 2015 study, female labour force participation ranges from nearly 80 percent in Switzerland to 70 percent in Germany and less than 60 Percent in the United States and Japan. Only 68 Percent of Canadian omen participated in the workforce in 1990; two decades later that increased to 74 Percent largely due to reforms including tax cuts for second earners and new childcare services. In Netherlands the female labour participation rate doubled since 1980 to 74 Percent as a result of expanded parental leave policies and the spread of flexible, part time working arrangements. In a 2014 survey of 143 emerging countries, the World Bank found that 90 Percent have at least one law that limits the economic opportunities available to women. These laws include bans or limitations on women owning property, opening a bank account, signing a contract, entering a courtroom, travelling alone, driving or controlling family finances. Such restrictions are particularly prevalent in the Middle East and South Asia with the world’s lowest female labour force participation, 26 and 35 percent respectively. According to date available with the International Labour Organisation (ILO), between 2004 and 2011, when the Indian economy grew at a healthy average of about 7 percent, there was a decline in female participation in the country’s labour force from over 35 percent to 25 percent. India also posted the lowest rate of female participation in the workforce among BRIC countries. India’s performance in female workforce participation stood at 27 percent, significantly behind China (64 percent), Brazil (59 percent), Russian Federation (57 percent), and South Africa (45 percent). The number of working women in India had climbed between 2000 and 2005, increasing from 34 percent to 37 percent, but since then the rate of women in the workforce has to fallen to 27 percent as of 2014, said the report citing data from the World Bank. The gap between male and female workforce participation in urban areas in 2011 stood at 40 percent, compared to rural areas where the gap was about 30 percent. However, in certain sectors like financial services, Indian women lead the charge. While only one in 10 Indian companies are led by women, more than half of them are in the financial sector. Today, women head both the top public and private banks in India. Another example is India’s aviation sector, 11.7 percent of India’s 5,100 pilots are women, versus 3 percent worldwide. But these successes only represent a small of women in the country. India does poorly in comparison to its neighbours despite a more robust economic growth. In comparison to India, women in Bangladesh have increased their participation in the labour market, which is due to the growth of the ready- made garment sector and a push to rural female employment. In 2015, women comprised of 43 percent of the labour force in Bangladesh. The rate has also increased in Pakistan, albeit from a very low starting point, while participation has remained relatively stable in Sri Lanka. Myanmar with 79 percent and Malaysia with 49 percent are also way ahead of India. Lack of access to higher education, fewer job opportunities, the lack of flexibility in working conditions, as well as domestic duties are cited as factors behind the low rates. Marriage significantly reduced the probability of women working by about 8 percent in rural areas and more than twice as much in urban areas, said an Assocham report. ILO attributes this to three factors: increasing educational enrolment, improvement in earning of male workers that discourage women’s economic participation, and lack of employment opportunities at certain levels of skills and qualifications discouraging women to seek work. The hurdles to working women often involve a combination of written laws and cultural norms. Cultures don’t change overnight but laws can. The IMF says that even a small step such as countries granting women the right to open a bank account can lead to substantial increase in female labour force participation over the next seven years. According to the United Nations Economic and Social Commission for Asia and the Pacific (ESCAP), even a 10 percent increase in women participating in the workforce can boost gross domestic product (GDP) by 0.3 percent. The OECD recently estimated that eliminating the gender gap would lead to an overall increase in GDP of 12 percent in its member nations between 2015 and 2030. The GDP gains would peak close to 20 percent in both Japan and South Korea and more than 20 percent in Italy. A similar analysis by Booz and Company showed that closing gender gap in emerging countries could yield even larger gains in GDP by 2020, ranging from a 34 percent gain in Egypt to 27 percent in India and 9 percent in Brazil. According to the above passage, though there are many reasons for low female labour force participation, the most important focus of the passage is on
 ....
MCQ->In year 2005 total population living in urban area is equal to sixty eight percent of educated population. The ratio of number of people living in urban area to people living in rural area is 43:12 in 2010. What is the ratio of the rural population in 2005 to that in 2010?....
MCQ-> Read the following passage carefully and answer the questions given below it. Certain words/phrases have been given in bold to help you locate them while answering some of the questions: In every religion, culture and civilization feeding the poor and hungry is considered one of the most noble deeds. However such large scale feeding will require huge investment both in resources and time. A better alternative is to create conditions by which proper wholesome food is available to all the rural poor at affordable price. Getting this done will be the biggest charity.Our work with the rural poor in villages of Western Maharashtra has shown that most of these people are landless laborers. After working the whole day in the fields in scorching sun they come home in the evening and have to cook for the whole family. The cooking is done on the most primitive chulha (wood stove) which results in tremendous indoor air pollution. Many of them also have no electricity so they use primitive and polluting kerosene lamps. World Health Organization (WHO) data has shown that about 300,000 deaths/ year in India can be directly attributed to indoor air pollution in such -nuts. At the same time this pollution results in many respiratory ailments and these people spend close Rs. 200-400 per month on medical bills. Besides the pollution, rural poor also eat very poor diet. They eat  whatever is available daily at Public Distribution System (PDS) shops and most of the times these shops are out of rations. Thus they cook whatever is available. The hard work together with poor eating takes a heavy toll on their health. Besides this malnutrition also affects the physical and mental health of their children and may lead to creation of a whole generation of mentally challenged citizens. So I feel that the best way to provide adequate food for rural poor is by setting up rural restaurants on large scale. These restaurants will be similar to regular ones but for people below poverty line (BPL) they will provide meals at subsidized rates. These citizens will pay only Rs. 10 per meal and the rest, which is expected to be quite small, will come as a part of Government subsidy. With existing open market prices of vegetables and groceries average cost of simple meal for a family of four comes to Rs. 50 per meal or Rs. 12.50 per person per meal. If the PDS prices are taken for the groceries then the average cost will be Rs. 7.50 per person per meal. This makes the subsidy approximately Rs. 2.50 per person per meal only and hence quite small. The buying of meals could be by the use of UID (Aadhar) card by rural poor. The total cost should be Rs. 30 per day for three vegetarian meals of breakfast, lunch and dinner. The rural poor will get better nutrition and tasty food by eating  in these restaurants. Besides the time saved can be used for resting and other gainful activities like teaching children. Since the food will not be cooked in huts, this strategy will result in less pollution in rural households. This will be beneficial for their health. Besides, women's chores will be reduced drastically. Another advantage of eating in these restaurants will be increased social interaction of rural poor since this could also become a meeting place. Eating in restaurants will also require fewer utensils in house and hence less expenditure. For other things like hot water for bath, making tea, boiling milk and cooking on holidays some utensils and fuel will be required. Our Institute NARI has developed an extremely efficient and environment-friendly stove which provides simultaneously both light and heat for cooking and hence may provide the necessary functions. Providing reasonably priced wholesome food is the basic aim and program of Government of India (GOI). This is the basis of their much touted food security  program.However in 65years they have not been able to do so. Thus I feel a public private partnership can help in this. To help the restaurant owners the GOI or state Governments should provide them with soft loans and other line of credit for setting up such facilities. Corporate world can take this up as a part of their corporate social responsibility activity. Their participation will help ensure good quality restaurants and services. Besides the charitable work, this will also make good business sense. McDonald's-type restaurant systems for rural areas can be a good model to be set up for quality control both in terms of hygiene and in terms of quality of food material. However focus will be on availability of wholesome simple vegetarian food in these restaurants.More clientele (volumes) will make these restaurants economical. Existing models of dhabas, udipi type restaurants etc. can be used in this scheme. These restaurants may also be able to provide midday meals in rural schools. At present the midday meal program is faltering due to various reasons. Food coupons in western countries provide cheap food for poor. However quite a number of fast food restaurants in US do not accept them. Besides these coupons are most of the times used for non-food items, it will be mandatory for rural restaurants to accept payment via UID cards for BPL citizens. Existing soup kitchens, lagers and temple food are based on charity. For large scale rural use it should be based on good social enterprise  business model. Cooking food in these restaurants will also result in much more efficient use of energy since energy/ kg of food cooked in households is greater than that in restaurants. The main thing however will be to reduce drastically the food wastage In these restaurants. Rural restaurants can also be forced to use clean fuels like LPG or locally produced biomass-based liquid fuels. This strategy is very difficult to enforce for individual households. Large scale employment generation in rural areas may result because of this activity. With an average norm of 30 people employed/ 100-chair restaurant, this program has the potential of generating about 20 million jobs permanently in rural areas. Besides the infrastructure development in setting up restaurants and establishing the food chain etc will help the local farmers and will create huge wealth generation in these areas. In the long run this strategy may provide better food security for rural poor than the existing one which is based on cheap food availability in PDS - a system which is prone to corruption and leakage.In accordance with the view expressed by the writer of this article, what is the biggest charity ?
 ....
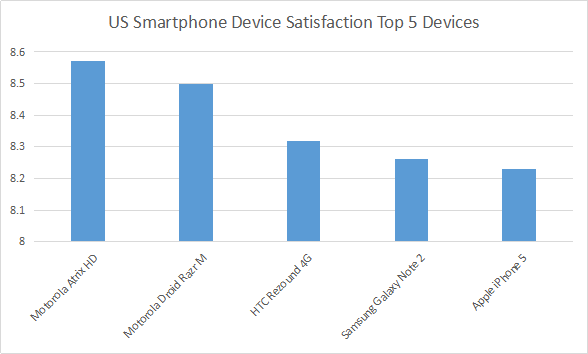
MCQ-> Please read the three reports (newspaper articles) on ranking of different players and products in smart phones industry and answer the questions that follow. Report 1: (Feb, 2013) Apple nabs crown as current top US mobile phone vendor Apple’s reign may not be long, as Samsung is poised to overtake Apple in April, 2013. For the first time since Apple entered the mobile phone market in 2007, it has been ranked the top mobile phone vendor in the US. For the latter quarter of 2012, sales of its iPhone accounted for 34 percent of all mobile phone sales in the US - including feature phones - according to the latest data from Strategy Analytics. While the iPhone has consistently been ranked the top smartphone sold in the US, market research firm NPD noted that feature phone sales have fallen off a cliff recently, to the point where 8 out of every 10 mobile phones sold in the US are now smartphones. That ratio is up considerably from the end of 2011, when smartphones had just cracked the 50 percent mark. Given this fact it’s no surprise that Apple, which only sells smartphones, has been able to reach the top of the overall mobile phone market domestically. For the fourth quarter of 2012, Apple ranked number one with 34 percent of the US mobile market, up from 25.6 percent year over year. Samsung grew similarly, up to 32.3 percent from 26.9 percent - but not enough to keep from slipping to second place. LG dropped to 9 percent from 13.7 percent, holding its third place spot. It should be noted that Samsung and LG both sell a variety of feature phones in addition to smartphones. Looking only at smartphones, the ranking is a little different according to NPD. Apple holds the top spot with 39 percent of the US smartphone market, while Samsung again sits at number two with 30 percent. Motorola manages to rank third with 7 percent, while HTC dropped to fourth with 6 percent. In the US smartphone market, LG is fifth with 6 percent. Note how the percentages aren’t all that different from overall mobile phone market share - for all intents and purposes, the smartphone market is the mobile phone market in the US going forward. Still, Samsung was the top mobile phone vendor overall for 2012, and Strategy Analytics expects Samsung to be back on top soon. “Samsung had been the number one mobile phone vendor in the US since 2008, and it will surely be keen to recapture that title in 2013 by launching improved new models such as the rumored Galaxy S4”. And while Apple is the top vendor overall among smartphones, its iOS platform is still second to the Android platform overall. Samsung is the largest vendor selling Android-based smartphones, but Motorola, HTC, LG, and others also sell Android devices, giving the platform a clear advantage over iOS both domestically and globally. Report 2: Reader’s Response (2013, Feb) I don’t actually believe the numbers for Samsung. Ever since the debacle in early 2011, when Lenovo called into question the numbers Samsung was touting for tablet shipments, stating that Samsung had only sold 20,000 of the 1.5 million tablets they shipped into the US the last quarter of 2010, Samsung (who had no response to Lenovo) has refused to supply quarterly sales numbers for smartphones or tablets. That’s an indication that their sales aren’t what analysts are saying. We can look to several things to help understand why. In the lawsuit between Apple and Samsung here last year, both were required to supply real sales numbers for devices under contention. The phones listed turned out to have sales between one third and one half of what had been guessed by IDC and others. Tablet sales were even worse. Of the 1.5 million tablets supposedly shipped to the US during that time, only 38,000 were sold. Then we have the usage numbers. Samsung tablets have only a 1.5% usage rate, where the iPad has over 90%. Not as much a difference with the phones but it’s still overwhelmingly in favor of iPhone. The problem is that with Apple’s sales, we have actual numbers to go by. The companies who estimate can calibrate what they do after those numbers come out. But with Samsung and many others, they can’t ever calibrate their methods, as there are no confirming numbers released from the firms. A few quarters ago, as a result, we saw iSupply estimate Samsung’s smartphone sales for the quarter at 32 million, with estimates from others all over the place up to 50 million. Each time some other company reported a higher number for that same quarter, the press dutifully used that higher number as THE ONE. But none of them was the one. Without accurate self-reporting of actual sales to the end users, none of these market share charts are worth a damn! Report 3: Contradictory survey (Feb, 2013) iPhone5 Ranks Fifth In U.S. Customer Satisfaction Survey inShare. The iPhone5 ranks fifth in customer satisfaction according to the results of a recent survey from OnDevice Research, a mobile device research group. In the poll, they asked 320,000 smartphone and tablet users from six different countries, how satisfied they were with their devices. According to 93,825 people from the US, Motorola Atrix HD is the most satisfying and Motorola’s Droid Razr took second spot. HTC Corp (TPE : 2498)’s Rezound 4G and Samsung Galaxy Note 2 took third and fourth spots, while Apple’s iPhone5 landed in fifth spot. It appears that Apple may be lagging in consumer interest. OnDevice Research, Sarah Quinn explained, “Although Apple created one of the most revolutionary devices of the past decade, other manufactures have caught up, with some Android powered devices now commanding higher levels of user satisfaction.” Despite the lower rankings, things aren’t looking too bad for Apple Inc. (NASDAQ:AAPL) elsewhere. In the United Kingdom, they ranked second place, right after HTC One X. Interesting enough, Apple did take top spot for overall satisfaction of mobile device, whereas Google Inc. (NASDAQ:GOOG) ranked second. Motorola Mobility Holdings Inc. (NYSE:NOK) took third, fourth, and fifth places respectively, while Sony Ericsson trailed behind at sixth place. The survey sampled mobile device users in the following countries: United States, United Kingdom, France, Germany, Japan, and Indonesia. Although OnDevice didn’t share the full list of devices mentioned in the survey, it does show some insight to what customers want. Unfortunately, there were still many questions regarding the survey that were left unanswered. Everyone wants to know why Google Inc. (NASDAQ:GOOG) was on the list when they are not an actual smartphone maker and why was Samsung Electronics Co., Ltd. (LON:BC94) on the bottom of the satisfaction list when the brand is leading elsewhere. Source: 92.825 US mobile users, July 2012 - January 2013 Fortunately, those questions were answered by OnDevice Research’s representative. He explained that the survey was conducted on mobile web where the survey software could detect the taker’s device and since user’s rate their satisfaction levels on a 1 to 10 scale, thanks to the Nexus device, Google was included.If you analyze the three reports above, which of the following statements would be the best inference?
 ....
MCQ-> Read the following passages carefully and answer the questions given at the end of each passage.PASSAGE 1In a study of 150 emerging nations looking back fifty years, it was found that the single most powerful driver of economic booms was sustained growth in exports especially of manufactured products. Exporting simple manufactured goods not only increases income and consumption at home, it generates foreign revenues that allow the country to import the machinery and materials needed to improve its factories without running up huge foreign bills and debts. In short, in the case of manufacturing, one good investment leads to another. Once an economy starts down the manufacturing path, its momentum can carry it in the right direction for some time. When the ratio of investment to GDP surpasses 30 percent, it tends to stick at the level for almost nine years (on an average). The reason being that many of these nations seemed to show a strong leadership commitment to investment, particularly to investment in manufacturing. Today various international authorities have estimated that the emerging world need many trillions of dollars in investment on these kinds of transport and communication networks. The modern outlier is India where investment as a share of the economy exceeded 30 percent of GDP over the course of the 2000s, but little of that money went into factories. Indian manufacturing had been stagnant for decades at around 15 percent of GDP. The stagnation stems from the failures of the state to build functioning ports and power plants and to create an environment in which the rules governing labour, land and capital are designed and enforced in a way that encourages entrepreneurs to invest, particularly in factories. India has disappointed on both counts creating labour friendly rules and workable land acquisition norms. Between 1989 and 2010 India generated about ten million new jobs in manufacturing, but nearly all those jobs were created in enterprises that are small and informal and thus better suited to dodge India’s bureaucracy and its extremely restrictive rules regarding firing workers It is commonly said in India that the labour laws are so onerous that it is practically impossible to comply with even half of them without violating the other half.Informal shops, many of them one man operations, now account for 39 percent of India’s manufacturing workforce, up from 19 percent in 1989 and they are simply too small to compete in global markets. Harvard economist Dani Rodrik calls manufacturing the “automatic escalator” of development, because once a country finds a niche in global manufacturing, productivity often seems to start rising automatically. During its boom years India was growing in large part on the strength of investment in technology service industries, not manufacturing. This was put forward as a development strategy. Instead of growing richer by exporting even more advanced manufactured products, India could grow rich by exporting the services demanded in this new information age. These arguments began to gain traction early in the 2010s.In new research on the “service escalators”, a 2014 working paper from the World Bank made the case that the old growth escalator in manufacturing was already giving way to a new one in service industries. The report argued that while manufacturing is in retreat as a share of the global economy and is producing fewer jobs, services are still growing, contributing more to growth in output and jobs for nations rich and poor. However, one basic problem with the idea of service escalator is that in the emerging world most of the new service jobs are still in very traditional ventures. A decade on, India’s tech sector is still providing relatively simple IT services mainly in the same back office operations it started with and the number of new jobs it is creating is relatively small. In India, only about two million people work in IT services, or less than 1 percent of the workforce. So far the rise of these service industries has not been big enough to drive the mass modernisation of rural farm economies. People can move quickly from working in the fields to working on an assembly line, because both rely for the most part on manual labour. The leap from the farm to the modern service sector is much tougher since those jobs often require advanced skills. Workers who have moved into IT service jobs have generally come from a pool of relatively better educated members of the urban middle class, who speak English and have atleast some facility with computers. Finding jobs for the underemployed middle class is important but there are limits to how deeply it can transform the economy, because it is a relatively small part of the population. For now, the rule is still factories first, not service first.According to the information in the above passage, manufacturing in India has been stagnant because there is
 ....
Terms And Service:We do not guarantee the accuracy of available data ..We Provide Information On Public Data.. Please consult an expert before using this data for commercial or personal use
DMCA.com Protection Status Powered By:Omega Web Solutions
© 2002-2017 Omega Education PVT LTD...Privacy | Terms And Conditions