Toggle navigation
Home
Article Category
Question Papers
General Knowlege
Popular Pages
Multiple Choice Question in 049
Multiple Choice Question in
Multiple Choice Question in 2016
Multiple Choice Question in TRADES-INSTRUCTOR---GR-II---SMITHY---TECHNICAL-EDUCATION
Multiple Choice Question in -current-affairs-2016
Question Answer in ASSISTANT-PROFESSOR---COMPUTER-SCIENCE-AND-ENGINEERING---TECHNICAL-EDUCATION
Multiple Choice Question in ASSISTANT-PROFESSOR---COMPUTER-SCIENCE-AND-ENGINEERING---TECHNICAL-EDUCATION
Multiple Choice Question in english
Multiple Choice Question in abbreviations-abbreviations-m
Multiple Choice Question in SSC CHSL 7 March 2018 Morning Shift
Multiple Choice Question in 072/2016
Question Answer Bank
Multiple Choice Question Bank
Question Answer Category
Multiple Choice Question Category
Home
->
Multiple Choice Questions
1. What is the India's rank in offering highest salaries to expats, as per 2016 HSBC Expat Explorer Survey?
(A): 11th
(B): 31st
(C): 23rd
(D): 3rd
Previous Question
Show Answer
Next Question
Add Tags
Report Error
Show Marks
Write Comment
Type in
(Press Ctrl+g to toggle between English and the chosen language)
Post reply
Comments
Tags
Show Similar Question And Answers
QA->Whichstate has topped list of endemic flowering plant in India, as per the recentlyreleased publication of Botanical Survey of India (BSI) titled “EndemicVascular Plants of India”?....
QA->What isthe India’s rank in terms of Foreign Direct Investment ( FDI) inflows, as per thelatest 2016 World Investment Report?....
QA->Name of the rogue planet which has been discovered by the Canada-France Brown Dwarfs Survey, a near infrared sky survey?....
QA->As per a study released by Lancet inMarch 2016 how many extra deaths will occur per million population in India dueto the impact of climate change on food production in 2050?....
QA->The first explorer to reach the South Pole was....
MCQ->What is the India's rank in offering highest salaries to expats, as per 2016 HSBC Expat Explorer Survey?....
MCQ-> Read the following passage to answer the given questions based on it. Some words/ phrases are printed in bold to help you locate them while answering some of the questions. India’s manufacturing growth fell to its lowest in more than two years in September, 2011,
reinforcing
fears that an extended period of high policy rates is hurting growth, according to a closely watched index. The HSBC India Purchasing Managers’ Index (PMI), based on a survey of over 500 companies, fell to 50.4 from 52.6 in August and 53.6 in July. It was the lowest since March 2009. when the reading was below 50. indicating contraction. September’s index also recorded the biggest one-month fall since November 2008. The sub index for new orders. which reflects future output, declined for the sixtli successive month, while xport orders full for it Liar(‘ month on the back of weakness in global economy. The Reserve Bank of India (RBI) last week indicated
it was not done yet
with monetary policy tightening as inflation was still high. The bank has already raised rates 12 times since March 2010 to
tame
inflation, which is at a 13-month high of 9.78%. Economists expect the RBI to raise rates one more time but warn that targeted growth will be hard to achieve if the
slump
continues. “This• (fall in PMI) was driven by weaker orders. with export orders still contracting due to the weaker global economic conditions.- HSBC said in a press release quoting its chief economist for India &ASEAN.; PMI is considered a fairly good indicator of manufacturing activity the world over. but in case of India, the large contribution of the unorganised sector
yields
a low correlation with industrial growth. However, the Index for Industrial Production (IIP) has been showing a weakening trend. having slipped to a 21- month low of 3.3 % in July. The core sector. which consists of eight infrastructure industries and has a combined weight of 37.9% in the IIP. also grew at only 3.5% in August. The PMI data is in line with the suffering manufacturing activity in India as per other estimates. Producers are seeing that demand conditions are softening and the outlook is uncertain, therefore they are producing less. Employment in the manufacturing sector declined for the second consecutive month, indicating it too was under pressure. This could be attributed to lower requirement of staff and rise in resignations as higher wage requests go unfulfilled, the HSBC statement said. On the inflation front, input prices rose at an 11 -month low rate, but despite signs of softening, they
still
remain at historically high levels. While decelerating slightly, the readings for input and output prices suggest that inflation pressures remain firmly in place. Most economists feel the RBI is close to the end of its rate hike cycle. Even the weekly Wholesale Price Index (WPI) estimates have started showing signs of softening. Having fallen more than one percentage point.The PMI is based on surveys of
....
MCQ-> Please read the three reports (newspaper articles) on ranking of different players and products in smart phones industry and answer the questions that follow. Report 1: (Feb, 2013)
Apple nabs crown as current top US mobile phone vendor
Apple’s reign may not be long, as Samsung is poised to overtake Apple in April, 2013. For the first time since Apple entered the mobile phone market in 2007, it has been ranked the top mobile phone vendor in the US. For the latter quarter of 2012, sales of its iPhone accounted for 34 percent of all mobile phone sales in the US - including feature phones - according to the latest data from Strategy Analytics. While the iPhone has consistently been ranked the top smartphone sold in the US, market research firm NPD noted that feature phone sales have fallen off a cliff recently, to the point where 8 out of every 10 mobile phones sold in the US are now smartphones. That ratio is up considerably from the end of 2011, when smartphones had just cracked the 50 percent mark. Given this fact it’s no surprise that Apple, which only sells smartphones, has been able to reach the top of the overall mobile phone market domestically. For the fourth quarter of 2012, Apple ranked number one with 34 percent of the US mobile market, up from 25.6 percent year over year. Samsung grew similarly, up to 32.3 percent from 26.9 percent - but not enough to keep from slipping to second place. LG dropped to 9 percent from 13.7 percent, holding its third place spot. It should be noted that Samsung and LG both sell a variety of feature phones in addition to smartphones. Looking only at smartphones, the ranking is a little different according to NPD. Apple holds the top spot with 39 percent of the US smartphone market, while Samsung again sits at number two with 30 percent. Motorola manages to rank third with 7 percent, while HTC dropped to fourth with 6 percent. In the US smartphone market, LG is fifth with 6 percent. Note how the percentages aren’t all that different from overall mobile phone market share - for all intents and purposes, the smartphone market is the mobile phone market in the US going forward. Still, Samsung was the top mobile phone vendor overall for 2012, and Strategy Analytics expects Samsung to be back on top soon. “Samsung had been the number one mobile phone vendor in the US since 2008, and it will surely be keen to recapture that title in 2013 by launching improved new models such as the rumored Galaxy S4”. And while Apple is the top vendor overall among smartphones, its iOS platform is still second to the Android platform overall. Samsung is the largest vendor selling Android-based smartphones, but Motorola, HTC, LG, and others also sell Android devices, giving the platform a clear advantage over iOS both domestically and globally.
Report 2: Reader’s Response (2013, Feb)
I don’t actually believe the numbers for Samsung. Ever since the debacle in early 2011, when Lenovo called into question the numbers Samsung was touting for tablet shipments, stating that Samsung had only sold 20,000 of the 1.5 million tablets they shipped into the US the last quarter of 2010, Samsung (who had no response to Lenovo) has refused to supply quarterly sales numbers for smartphones or tablets. That’s an indication that their sales aren’t what analysts are saying. We can look to several things to help understand why. In the lawsuit between Apple and Samsung here last year, both were required to supply real sales numbers for devices under contention. The phones listed turned out to have sales between one third and one half of what had been guessed by IDC and others. Tablet sales were even worse. Of the 1.5 million tablets supposedly shipped to the US during that time, only 38,000 were sold. Then we have the usage numbers. Samsung tablets have only a 1.5% usage rate, where the iPad has over 90%. Not as much a difference with the phones but it’s still overwhelmingly in favor of iPhone. The problem is that with Apple’s sales, we have actual numbers to go by. The companies who estimate can calibrate what they do after those numbers come out. But with Samsung and many others, they can’t ever calibrate their methods, as there are no confirming numbers released from the firms. A few quarters ago, as a result, we saw iSupply estimate Samsung’s smartphone sales for the quarter at 32 million, with estimates from others all over the place up to 50 million. Each time some other company reported a higher number for that same quarter, the press dutifully used that higher number as THE ONE. But none of them was the one. Without accurate self-reporting of actual sales to the end users, none of these market share charts are worth a damn!
Report 3: Contradictory survey (Feb, 2013)
iPhone5 Ranks Fifth In U.S. Customer Satisfaction Survey inShare. The iPhone5 ranks fifth in customer satisfaction according to the results of a recent survey from OnDevice Research, a mobile device research group. In the poll, they asked 320,000 smartphone and tablet users from six different countries, how satisfied they were with their devices. According to 93,825 people from the US, Motorola Atrix HD is the most satisfying and Motorola’s Droid Razr took second spot. HTC Corp (TPE : 2498)’s Rezound 4G and Samsung Galaxy Note 2 took third and fourth spots, while Apple’s iPhone5 landed in fifth spot. It appears that Apple may be lagging in consumer interest. OnDevice Research, Sarah Quinn explained, “Although Apple created one of the most revolutionary devices of the past decade, other manufactures have caught up, with some Android powered devices now commanding higher levels of user satisfaction.” Despite the lower rankings, things aren’t looking too bad for Apple Inc. (NASDAQ:AAPL) elsewhere. In the United Kingdom, they ranked second place, right after HTC One X. Interesting enough, Apple did take top spot for overall satisfaction of mobile device, whereas Google Inc. (NASDAQ:GOOG) ranked second. Motorola Mobility Holdings Inc. (NYSE:NOK) took third, fourth, and fifth places respectively, while Sony Ericsson trailed behind at sixth place. The survey sampled mobile device users in the following countries: United States, United Kingdom, France, Germany, Japan, and Indonesia. Although OnDevice didn’t share the full list of devices mentioned in the survey, it does show some insight to what customers want. Unfortunately, there were still many questions regarding the survey that were left unanswered. Everyone wants to know why Google Inc. (NASDAQ:GOOG) was on the list when they are not an actual smartphone maker and why was Samsung Electronics Co., Ltd. (LON:BC94) on the bottom of the satisfaction list when the brand is leading elsewhere.
Source: 92.825 US mobile users, July 2012 - January 2013
Fortunately, those questions were answered by OnDevice Research’s representative. He explained that the survey was conducted on mobile web where the survey software could detect the taker’s device and since user’s rate their satisfaction levels on a 1 to 10 scale, thanks to the Nexus device, Google was included.If you analyze the three reports above, which of the following statements would be the best inference?
....
MCQ-> India is rushing headlong toward economic success and modernisation, counting on high- tech industries such as information technology and biotechnology to propel the nation toprosperity. India’s recent announcement that it would no longer produce unlicensed inexpensive generic pharmaceuticals bowed to the realities of the World TradeOrganisation while at the same time challenging the domestic drug industry to compete with the multinational firms. Unfortunately, its weak higher education sector constitutes the
Achilles’ Heel
of this strategy. Its systematic disinvestment in higher education inrecent years has yielded neither world-class research nor very many highly trained scholars, scientists, or managers to
sustain
high-tech development. India’s main competitors especially China but also Singapore, Taiwan, and South Korea — are investing in large and differentiated higher education systems. They are providingaccess to large number of students at the bottom of the academic system while at the same time building some research-based universities that are able to compete with theworld’s best institutions. The recent London Times Higher Education Supplement ranking of the world’s top 200 universities included three in China, three in Hong Kong,three in South Korea, one in Taiwan, and one in India (an Indian Institute of Technology at number 41.— the specific campus was not specified). These countries are positioningthemselves for leadership in the knowledge-based economies of the coming era. There was a time when countries could achieve economic success with cheap labour andlow-tech manufacturing. Low wages still help, but contemporary large-scale development requires a sophisticated and at least partly knowledge-based economy.India has chosen that path, but will find a major stumbling block in its university system. India has significant advantages in the 21st century knowledge race. It has a large high ereducation sector — the third largest in the world in student numbers, after China andthe United States. It uses English as a primary language of higher education and research. It has a long academic tradition. Academic freedom is respected. There are asmall number of high quality institutions, departments, and centres that can form the basis of quality sector in higher education. The fact that the States, rather than the Central Government, exercise major responsibility for higher education creates a rather
cumbersome
structure, but the system allows for a variety of policies and approaches. Yet the weaknesses far outweigh the strengths. India educates approximately 10 per cent of its young people in higher education compared with more than half in the major industrialised countries and 15 per cent in China. Almost all of the world’s academic systems resemble a pyramid, with a small high quality tier at the top and a massive sector at the bottom. India has a tiny top tier. None of its universities occupies a solid position at the top. A few of the best universities have some excellent departments and centres, and there is a small number of outstanding undergraduate colleges. The University Grants Commission’s recent major support of five universities to build on their recognised strength is a step toward recognising a
differentiated
academic system and fostering excellence. At present, the world-class institutions are mainly limited to the Indian Institutes of Technology (IITs), the Indian Institutes of Management (IIMs) and perhaps a few others such as the All India Institute of Medical Sciences and the Tata Institute of Fundamental Research. These institutions, combined, enroll well under 1 percent of the student population. India’s colleges and universities, with just a few exceptions, have become large, under-funded, ungovernable institutions. At many of them, politics has intruded into campus life, influencing academic appointments and decisions across levels. Under-investment in libraries, information technology, laboratories, and classrooms makes it very difficult to provide top-quality instruction or engage in cutting-edge research.The rise in the number of part-time teachers and the freeze on new full-time appointments in many places have affected morale in the academic profession. The lackof accountability means that teaching and research performance is seldom measured. The system provides few incentives to perform. Bureaucratic inertia hampers change.Student unrest and occasional faculty agitation disrupt operations. Nevertheless, with a semblance of normality, faculty administrators are. able to provide teaching, coordinate examinations, and award degrees. Even the small top tier of higher education faces serious problems. Many IIT graduates,well trained in technology, have chosen not to contribute their skills to the burgeoning technology sector in India. Perhaps half leave the country immediately upon graduation to pursue advanced study abroad — and most do not return. A stunning 86 per cent of students in science and technology fields from India who obtain degrees in the United States do not return home immediately following their study. Another significant group, of about 30 per cent, decides to earn MBAs in India because local salaries are higher.—and are lost to science and technology.A corps of dedicated and able teachers work at the IlTs and IIMs, but the lure of jobs abroad and in the private sector make it increasingly difficult to lure the best and brightest to the academic profession.Few in India are thinking creatively about higher education. There is no field of higher education research. Those in government as well as academic leaders seem content to do the “same old thing.” Academic institutions and systems have become large and complex. They need good data, careful analysis, and creative ideas. In China, more than two-dozen higher education research centers, and several government agencies are involved in higher education policy.India has survived with an increasingly mediocre higher education system for decades.Now as India strives to compete in a globalized economy in areas that require highly trained professionals, the quality of higher education becomes increasingly important.India cannot build internationally recognized research-oriented universities overnight,but the country has the key elements in place to begin and sustain the process. India will need to create a dozen or more universities that can compete internationally to fully participate in the new world economy. Without these universities, India is destined to remain a scientific backwater.Which of the following ‘statement(s) is/are correct in the context of the given passage ? I. India has the third largest higher education sector in the world in student numbers. II. India is moving rapidly toward economic success and modernisation through high tech industries such as information technology and bitechonology to make the nation to prosperity. III. India’s systematic disinvestment in higher education in recent years has yielded world class research and many world class trained scholars, scientists to sustain high-tech development.....
MCQ-> The first table gives the number of saris (of all the eight colours) stocked in six regional showrooms. The second gives the number of saris (of all the eight colours) sold in these six regional showrooms. The third table gives the percentage of saris sold to saris stocked for each colour in each region. The fourth table gives the percentage of saris of a specific colour sold within that region. The fifth table gives the percentage of saris of a specific colour sold across all the regions. Study the tables and for each of the following questions, choose the best alternative.Table 1
Table 2
Table 3
Table 4
Table 5
Which region-colour combination accounts for the highest percentage of sales to stock?
....
×
×
Type The Issue
×
Your Marks
Terms And Service:We do not guarantee the accuracy of available data ..We Provide Information On Public Data.. Please consult an expert before using this data for commercial or personal use
Powered By:Omega Web Solutions
© 2002-2017 Omega Education PVT LTD...
Privacy
|
Terms And Conditions
 Powered By:Omega Web Solutions
 Source: 92.825 US mobile users, July 2012 - January 2013
Fortunately, those questions were answered by OnDevice Research’s representative. He explained that the survey was conducted on mobile web where the survey software could detect the taker’s device and since user’s rate their satisfaction levels on a 1 to 10 scale, thanks to the Nexus device, Google was included.If you analyze the three reports above, which of the following statements would be the best inference?
Source: 92.825 US mobile users, July 2012 - January 2013
Fortunately, those questions were answered by OnDevice Research’s representative. He explained that the survey was conducted on mobile web where the survey software could detect the taker’s device and since user’s rate their satisfaction levels on a 1 to 10 scale, thanks to the Nexus device, Google was included.If you analyze the three reports above, which of the following statements would be the best inference?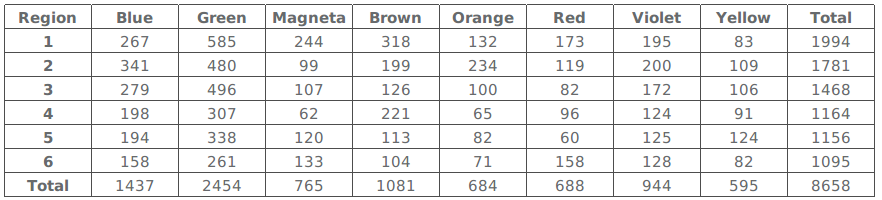 Table 2
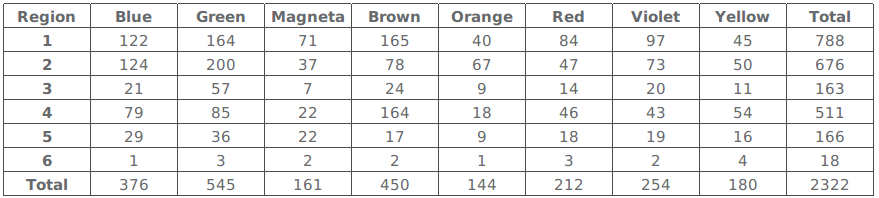 Table 3
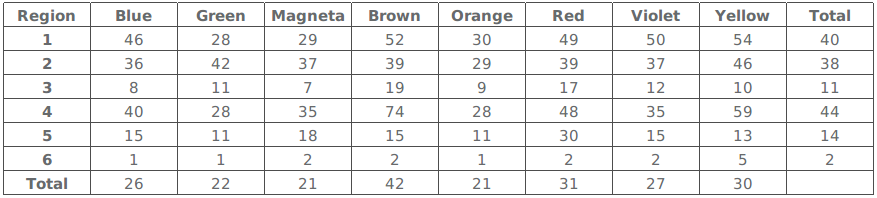 Table 4
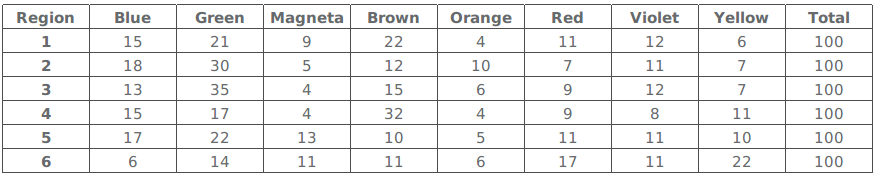 Table 5
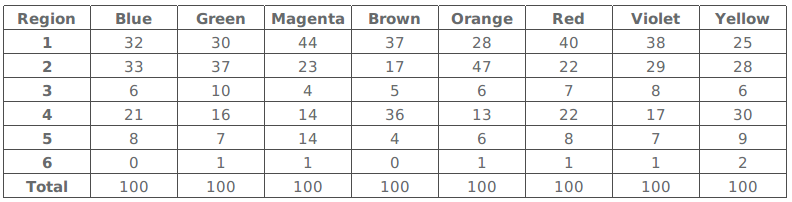 Which region-colour combination accounts for the highest percentage of sales to stock?