1. In the diagram given below ‘D’ represents the depot and A, B, C are the retail outlets points such that the distance between ‘D’ and ‘A’ is 10 kms. ‘D’ and ‘B’ is 15 kms. and D and C is 20 kms. Distance from ‘A’ to ‘B’ is 5 kms and ‘B’ to ‘C’ is 7 kms. What is the saving in kms, if the route is optimised on any day and a vehicle has limit of 50 kms. per day and load wise it can pick up the the load of ‘A’, ‘B’ and ‘C’ in one loading:


Write Comment

Type in
(Press Ctrl+g to toggle between English and the chosen language)

Comments

  • By: anil on 05 May 2019 02.44 am
    normal route distance=2DA + 2DB + 2DC=90km optimized route distance=DA + AB + BC + CD=42km the saving in distance=90-42=48km
Show Similar Question And Answers
QA->Star Hyper is a chain of retail stores in India created as a JV between Tatas and which global retail chain ?....
QA->As per the section IV of Motor vehicle act 1988, the minimum age limit for obtaining a driving license to drive a transport vehicle is :....
QA->Routine is not loaded until it is called. All routines are kept on disk in a relocatable load format. The main program is loaded into memory and is executed. This type of loading is called:....
QA->Any industry located in a rural area which produces any goods or renders any service with or without the use of power and in which the fixed capital investment per head of a worker does not exceed one lakh rupees is known as:....
QA->As per the motor vehicle act 1988, the maximum speed limit for motor cycle is :....
MCQ->In the diagram given below ‘D’ represents the depot and A, B, C are the retail outlets points such that the distance between ‘D’ and ‘A’ is 10 kms. ‘D’ and ‘B’ is 15 kms. and D and C is 20 kms. Distance from ‘A’ to ‘B’ is 5 kms and ‘B’ to ‘C’ is 7 kms. What is the saving in kms, if the route is optimised on any day and a vehicle has limit of 50 kms. per day and load wise it can pick up the the load of ‘A’, ‘B’ and ‘C’ in one loading:....
MCQ-> Read the following passage to answer the given question based on it. Some words/phrases are printed in bold to help you locate them while answering some of the questions.Organized retail has “fuelled” new growth categories like liquid hand wash, breakfast cereals and pet foods in the consumer goods industry accounting for almost 50% of their sales said data from market search firm Nielsen The figures showed some of these new categories got more than 40% of their business from modern retail outlets.The data also suggests how products in these categories reach the neighbourhood kirana stores after they have established themselves in modern trade While grocers continue to be an important channel for the new and evolving categories we saw an increased presence of the high end products in modern trade For example premium products in laundry detergents dishwashing car air fresheners and surface care increased in availability through this format as these products are aimed at “affluent” consumers who are more likely to shop in supermarket/hypermarket outlets and who are willing to pay more for specialized products Some other categories that have grown exceptionally and now account for bulk of the sales from modern retail are frozen and With the evolution of modern trade our growth in this channel has been healthy as it is for several other categories Modern retail is an important part of our business said managing director Kellogg India. What modern retail offers to companies experimenting with new categories is the chance to educate customers which was not the case with a general trade store Category creation and market development starts with modern trade but as more consumer start consuming this category they “penetrate into other channels” said president food FMCG category Future Group the country’s largest retailer which operates stores like Big Bazaar But a point to note here is that modern retailers themselves push their own private brands in these very categories and can emerge as a big threat for the consumers goods and foods companies For instance Big Bazaar’s private label Clean Mate is hugely popular and sells more than a brand like Harpic in its own stores So there is a certain amount of conflict and competition that will play out over the next few years which the FMCG companies will have to watch out for said KPMG’s executive director (retail) In the past there have been instances of retailers boycotting products from big FMCG players on the issue of margins but as modern retail become increasingly significant for “pushing” new categories experts say we could see more partnerships being forged between retailers and FMCG companies Market development for new categories takes time so brand wars for leadership and consumer franchise will be fought on the modern retail platform A new brand can overnight compete with “established” companies by trying up with few retailers in these categories president of Future Group addedWhich of the following is being referred to as new growth category ?
 ....
MCQ-> Read the following caselet and choose the best alternative  The BIG and Colourful Company You are running "BIG and Colourful (BnC)" company that sells books to customers through three retail formats: a. You can buy books from bookstores, b. You can buy books from supermarket, c. You can order books over the Internet (Online). Your manager has an interesting way of classifying expenses: some of the expenses are classified in terms of size: Big, Small and Medium; and others are classified in terms of the colors, Red, Yellow, Green and Violet. The company has a history of categorizing overall costs into initial costs and additional costs. Additional costs are equal to the sum of Big, Small and Medium expenses. There are two types of margins, contribution (sales minus initial costs) and profit (contribution minus additional costs). Given below is the data about sales and costs of BnC: Each of the Big, Small and Medium cost is categorized by the manager into Red, Yellow, Green and Violet costs. Breakdown of the additional costs under these headings is shown in the table below: 
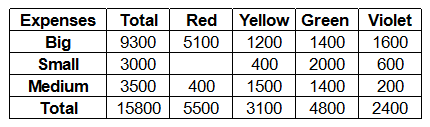
Red, Yellow, Green and Violet costs are allocated to different retail formats. These costs are apportioned in the ratio of number of units consumed by each retail format. The number of units consumed by each retail format is given in the table below: 
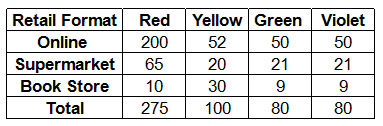
Read the following statements: Statement I. Online store accounted for 50% of the sales at BnC and the ratio of supermarket sales and book store sales is 1:2. 
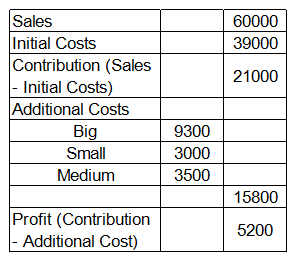
Statement II. Initial Cost is allocated in the ratio of sales. If you want to calculate the profit/loss from the different retail formats, then....
MCQ-> Directions : Study the following information carefully and answer these questions. A word and number arrangement machine when given an input line of words and numbers rearranges them following a particular rule in each step. The following is an illustration of input and rearrangement. (All the numbers are two digits numbers) Input : tall 48 13 rise alt 99 76 32 wise jar high 28 56 barn Step I : 13 tall 48 rise 99 76 32 wise jar high 28 56 barn alt Step II : 28 13 tall 48 rise 99 76 32 wise jar high 56 alt barn Step III : 32 28 13 tall 48 rise 99 76 wise jar 56 alt barn high Step IV : 48 32 28 13 tall rise 99 76 wise 56 alt barn high jar Step V : 56 48 32 28 13 tall 99 76 wise alt barn high jar rise Step VI : 76 56 48 32 28 13 99 wise alt barn high jar rise tall Step VII : 99 76 56 48 32 28 13 alt barn high jar rise tall wise and Step VII is the last step of the above input, as the desired arrangement is obtained. As per the rules followed in the above steps, find out in each of the following questions the appropriate step for the given input. Input : 84 why sit 14 32 not best ink feet 51 27 vain 68 92 (All the numbers are two digits numbers)Which step number is the following output? 32 27 14 84 why sit not 51 vain 92 68 feet best ink....
MCQ-> Read the following passage carefully and answer the questions based on it. Some words have been printed in bold to help you locate them while answering some of the questions.Notwithstanding the fact that the share of household savings to GDS is showing decline, still this segment is the significant contributor to GDS with 70% share. Indian households are among the most frugal in the world However, commensurate capital formation has not been taking place as a lion's share of household savings are being parked in physical assets compared to financial assets. The pattern of disposition of saving is an important factor in determining how the saved amount is utilized for productive purposes. The proportion of household saving in financial assets determines the channelisation of saving for investment in other sectors of the economy. However, the volume of investment of saving in physical assets determines the productivity and generation of income in that sector itself. Post-Independence era has witnessed a significant shift in deployment of household savings especially the share of financial assets increased from 26.39% in 1950 to 54.05% in 1990 may be on account of increased bank branch network across the country coupled with improved awareness of investors on various financial / banking products. However, contrast to common expectations, the share of financial assets in total household savings has come down from 54.05% to 50.21% especially in post reform period i.e. 1990 to 2010 despite providing easy access and availability of banking facilities compared to earlier years. The increased share of physical assets over financial assets (around 4%) during the last two decades is a cause of concern requires focused attention to arrest the trend. Traditionally, the Indians are risk-averse and prefer to invest surplus funds in physical assets such as Gold, Silver and lands. Nevertheless, considerable share of savings also owing to financial assets, which includes, Currency, Bank Deposits, Claims on Government, Contractual Savings, Equities The composition of household financial savings shows that the bank deposits (44%) continue to remain the major contributor along with the rise in the Contractual Savings, Claims on Government and Currency. Though there was gradual decline in currency holdings by the households i.e. 13.79% in 1970s to 9.30% in 2007, still the present currency holding level with households appears to be on high side compared to other countries. The primary reasons for higher currency holdings could be absence of banking facilities in majority villages (5.70 lakh villages)as well as hoarding of unaccounted money in the form of cash to circumvent tax laws. Though, cash is treated as financial asset, in reality, a major portion of currency is blocked and become unproductive. Bank deposits seemed to be the preferred choice mainly on account of its inbuilt features such as Safety, Security and Liquidity. Traditionally, the Household sector has been playing a leading role in the landscape of bank deposits followed by the Government sector. However, the last two decades has witnessed significant shift in ownership of Bank deposits. While there was improvement in Corporate and Government sectors' share by 8.30% and 7.20% respectively during the period 1999 to 2009, household sector lost a share of 13.30% in the post reform period. In the post independence era, Indian financial system was characterized by poor infrastructure and low level of financial deepening. Savings in physical assets constituted the largest portion of the savings compared to the financial assets in the initial years of the planning periods. While rural households were keen on acquiring farm assets, the portfolio of urban households constituted consumer durables, gold, jewellery and house property.Despite the fact that the household savings have been gradually moving from physical assets to financial assets over the years, still 49.79% of household savings are wrapped in unproductive physical assets, which is a cause of concern as the share of physical assets to total savings are very high in the recent years compared to emerging economies. This trend needs to be arrested as scarce funds are being diverted into unproductive segments. Of course, investment in Real estate sector can be treated as productive provided construction activity is commenced within reasonable time, but it is regrettably note that many investors just buy and hold it for speculation leading to unproductive investments. India has probably the largest fascination with gold than any other country in the world with a share of 9.50% of the world's total gold holdings. The World Gold Council believes that they are over 18000 tonnes of gold holding in the country. More impressive is the fact that current demand from India alone consumes 25% of the world's annual gold output. Large amount of capital is blocked in gold which resides in bank lockers and remain unproductive. Indian economy would grow faster if the capital markets could attract more of the nation's savings and channel them into more productive areas, especially infrastructure. If the Indian market can develop and evolve into a more mature financial system, which persuades the middle class to put more of its money into equities, the potential is mind-boggling.Which of the following statement (s) is/are correct in the context of the given passage? I. The GDS percentage to GDP has shown considerable improvement from 10% in 1950 to 33.7% in 2010, which is one of the highest globally. II. The saving rate however shows an increasing trend, marginal decline is observed under tic use hold sector. III. The share of financial assets in total household savings have come down from 54.05% to 21% especially in post reform era.....
Terms And Service:We do not guarantee the accuracy of available data ..We Provide Information On Public Data.. Please consult an expert before using this data for commercial or personal use
DMCA.com Protection Status Powered By:Omega Web Solutions
© 2002-2017 Omega Education PVT LTD...Privacy | Terms And Conditions