1.
Read the following caselet and choose the best alternative
The BIG and Colourful Company
You are running "BIG and Colourful (BnC)" company that sells books to customers through three retail formats:
a. You can buy books from bookstores,
b. You can buy books from supermarket,
c. You can order books over the Internet (Online).
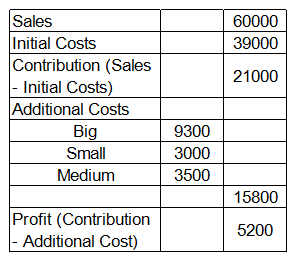
Your manager has an interesting way of classifying expenses: some of the expenses are classified in terms of size: Big, Small and Medium; and others are classified in terms of the colors, Red, Yellow, Green and Violet. The company has a history of categorizing overall costs into initial costs and additional costs. Additional costs are equal to the sum of Big, Small and Medium expenses. There are two types of margins, contribution (sales minus initial costs) and profit (contribution minus additional costs). Given below is the data about sales and costs of BnC:
 Each of the Big, Small and Medium cost is categorized by the manager into Red, Yellow, Green and Violet costs. Breakdown of the additional costs under these headings is shown in the table below:
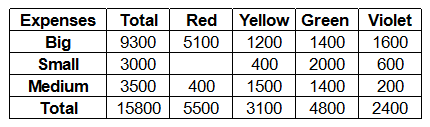 Red, Yellow, Green and Violet costs are allocated to different retail formats. These costs are apportioned in the ratio of number of units consumed by each retail format. The number of units consumed by each retail format is given in the table below:
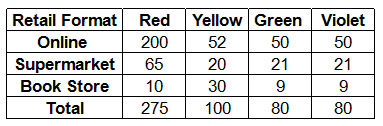 Read the following statements:
Statement I. Online store accounted for 50% of the sales at BnC and the ratio of supermarket sales and book store sales is 1:2.
Statement II. Initial Cost is allocated in the ratio of sales. If you want to calculate the profit/loss from the different retail formats, then
Read the following statements:
Statement I. Online store accounted for 50% of the sales at BnC and the ratio of supermarket sales and book store sales is 1:2.
Statement II. Initial Cost is allocated in the ratio of sales. If you want to calculate the profit/loss from the different retail formats, then
Show Similar Question And Answers
 Source: 92.825 US mobile users, July 2012 - January 2013
Fortunately, those questions were answered by OnDevice Research’s representative. He explained that the survey was conducted on mobile web where the survey software could detect the taker’s device and since user’s rate their satisfaction levels on a 1 to 10 scale, thanks to the Nexus device, Google was included.If you analyze the three reports above, which of the following statements would be the best inference?
Source: 92.825 US mobile users, July 2012 - January 2013
Fortunately, those questions were answered by OnDevice Research’s representative. He explained that the survey was conducted on mobile web where the survey software could detect the taker’s device and since user’s rate their satisfaction levels on a 1 to 10 scale, thanks to the Nexus device, Google was included.If you analyze the three reports above, which of the following statements would be the best inference?