1.
The bar graph shows the production of table fans in a factory during one week. Study the bar graph and answer the question. The maximum production exceeds the minimum production by:
Write Comment
Comments
- By: anil on 05 May 2019 01.50 amMaximum production of the week on Tuesday = 540 Minimum production of the week on Thursday = 120 => Required difference = 540 - 120 = 420 => Ans - (B)
Show Similar Question And Answers
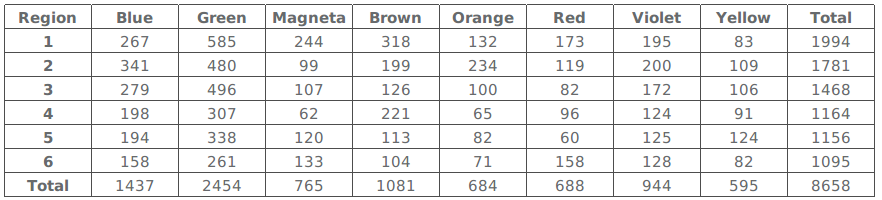 Table 2
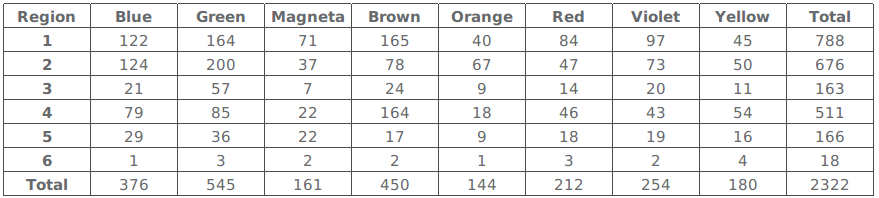 Table 3
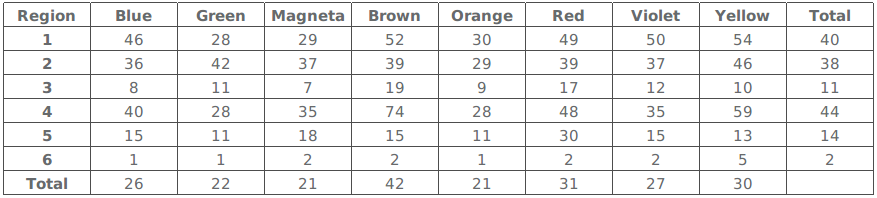 Table 4
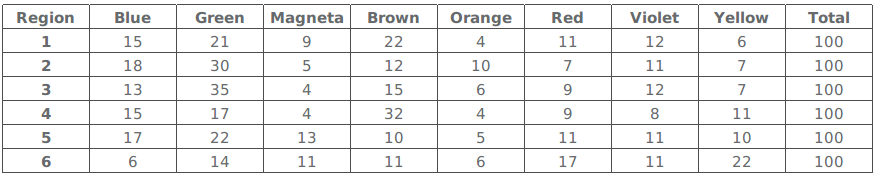 Table 5
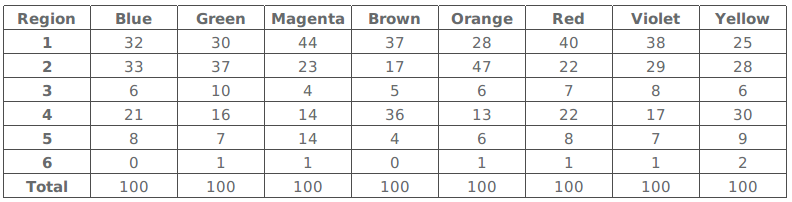 Which region-colour combination accounts for the highest percentage of sales to stock?
 Average Sales of Product A minus Average Sales of Product B
After taking a print out of the above table, she attempted to look at the trend of sales and plotted a graph in MS Excel. Later she took a print out of the graph and left for a meeting. While on her way she figured out that due to some printer cartridge problem sales of Product A in 2013, Product C in 2010, and Product D in 2012 were not visible in the graph as reproduced below. Anita had to make some quick calculations to arrive at the information outlined in the following question.
Average Sales of Product A minus Average Sales of Product B
After taking a print out of the above table, she attempted to look at the trend of sales and plotted a graph in MS Excel. Later she took a print out of the graph and left for a meeting. While on her way she figured out that due to some printer cartridge problem sales of Product A in 2013, Product C in 2010, and Product D in 2012 were not visible in the graph as reproduced below. Anita had to make some quick calculations to arrive at the information outlined in the following question.
 What are the sales of Product A in 2013, Product C in 2010 and Product D in 2012?