Toggle navigation
Home
Article Category
Question Papers
General Knowlege
Popular Pages
Multiple Choice Question in 049
Multiple Choice Question in
Multiple Choice Question in 2016
Multiple Choice Question in TRADES-INSTRUCTOR---GR-II---SMITHY---TECHNICAL-EDUCATION
Multiple Choice Question in -current-affairs-2016
Question Answer in ASSISTANT-PROFESSOR---COMPUTER-SCIENCE-AND-ENGINEERING---TECHNICAL-EDUCATION
Multiple Choice Question in ASSISTANT-PROFESSOR---COMPUTER-SCIENCE-AND-ENGINEERING---TECHNICAL-EDUCATION
Multiple Choice Question in english
Multiple Choice Question in abbreviations-abbreviations-m
Multiple Choice Question in SSC CHSL 7 March 2018 Morning Shift
Multiple Choice Question in 072/2016
Question Answer Bank
Multiple Choice Question Bank
Question Answer Category
Multiple Choice Question Category
Home
->
Multiple Choice Questions
1. The average production of table fan in that week is
(A): 370
(B): 280
(C): 300
(D): 250
Previous Question
Show Answer
Next Question
Add Tags
Report Error
Show Marks
Write Comment
Type in
(Press Ctrl+g to toggle between English and the chosen language)
Post reply
Comments
Tags
2016 SSC CGL 29 Aug Morning Shift
Show Similar Question And Answers
QA->Ram sends 50 table fans to Rahim costing Rs300 per table fan, to be sold at 20% above cost price. Sales will be ………….....
QA->The United Nations declared 4th week of September which week?....
QA->Average age of 15persons is 24 years. Later a boy is included into this group then average becomes 23 years. The age of the boy will be:....
QA->In a class of 20 students the average age is 16 years.If the age of the class teacher is added to that of students,the average age of the class becomes 17 years.What is the age of the teacher?....
QA->The annual average rate of net plant production is highest in which forests?....
MCQ-> The first table gives the number of saris (of all the eight colours) stocked in six regional showrooms. The second gives the number of saris (of all the eight colours) sold in these six regional showrooms. The third table gives the percentage of saris sold to saris stocked for each colour in each region. The fourth table gives the percentage of saris of a specific colour sold within that region. The fifth table gives the percentage of saris of a specific colour sold across all the regions. Study the tables and for each of the following questions, choose the best alternative.Table 1
Table 2
Table 3
Table 4
Table 5
Which region-colour combination accounts for the highest percentage of sales to stock?
....
MCQ-> Read the following information and tables and answer the questions that follow.Torrent Enterprises sells air conditioners of Eagle Brand in the retail market of Delhi. The month-wise total number of Window Air Conditioner (WAC) units sold by Torrent during April 2014 to March 2015 are shown below in Table A. Table B shows the share of different types of WACs in total monthly sales for the said period. Number of Units Sold by Torrent Enterprises During the Period April 14 to March 15 Table A
Table B
Performance measures are as follows: Half Yearly Sales Performance:$$\frac{\text{Oct 14 to Mar 15 Average Sales - April 14 to Sep 14 Average Sales}}{\text{April 14 to Sep 14 Average Sales}}$$Monthly Sales Performance: $$\frac{\text{Current Month Sales - Pervious Month Sales}}{\text{Previous Month Sales}}$$Sales Volatility: $$\frac{\text{Maximum Monthly Sales - Minimum Monthly Sales}}{\text{Average Monthly Sales}}$$What is the closest average number of 11⁄2 ton Window ACs sold by Torrent Enterprises during April 2014 - March 2015?
....
MCQ-> Answer the questions based on the following information. The first table gives the percentage of students in MBA class, who sought employment in the areas of finance, marketing and software. The second table gives the average starting salaries of the students per month, (rupees in thousands) in these areas. The third table gives the number of students who passed out in each year. Table 1:
Table 2:
Table 3:
The number of students who get jobs in finance is less than the students getting marketing jobs, in the 5 years, by
....
MCQ->The average production of table fans on Monday & Tuesdays exceeds the average production of table fans during the week by....
MCQ-> Read the following information, graph and table and answer the questions that follow. Ellen Inc. is a Mumbai based company which sells five products branded as A, B, C, D and E in India. Anita looks after entire sales of North India working from regional office in Delhi. She was preparing for annual review meeting scheduled next day in Mumbai. She was attempting to analyse sales in North India for the seven year period from 2009 to 2015. She first calculated average sales in rupees of all the five brands and constructed a table exhibiting the difference between average sales of each pair of brands as shown in the following table:
Average Sales of Product A minus Average Sales of Product B After taking a print out of the above table, she attempted to look at the trend of sales and plotted a graph in MS Excel. Later she took a print out of the graph and left for a meeting. While on her way she figured out that due to some printer cartridge problem sales of Product A in 2013, Product C in 2010, and Product D in 2012 were not visible in the graph as reproduced below. Anita had to make some quick calculations to arrive at the information outlined in the following question.
What are the sales of Product A in 2013, Product C in 2010 and Product D in 2012?
....
×
×
Type The Issue
×
Your Marks
Terms And Service:We do not guarantee the accuracy of available data ..We Provide Information On Public Data.. Please consult an expert before using this data for commercial or personal use
Powered By:Omega Web Solutions
© 2002-2017 Omega Education PVT LTD...
Privacy
|
Terms And Conditions
 Powered By:Omega Web Solutions
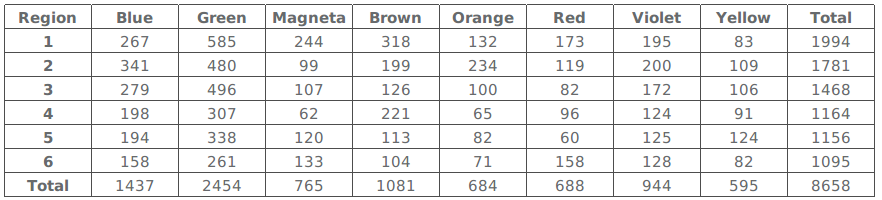 Table 2
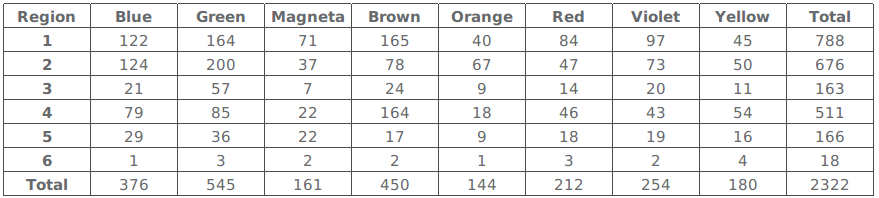 Table 3
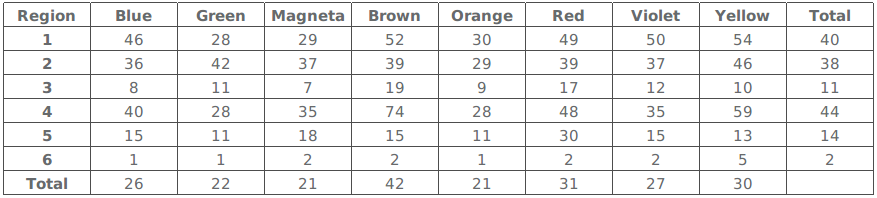 Table 4
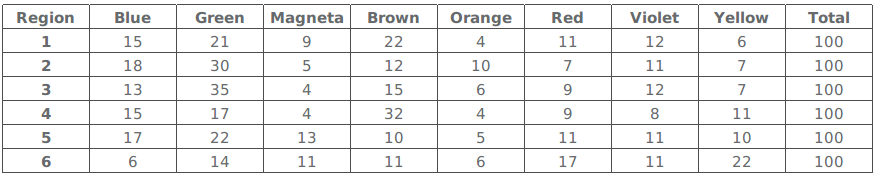 Table 5
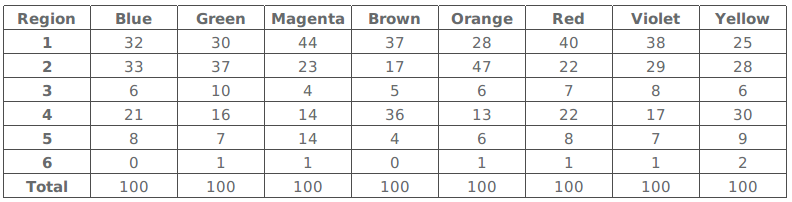 Which region-colour combination accounts for the highest percentage of sales to stock?
 Table B
 Performance measures are as follows:
Half Yearly Sales Performance:$$\frac{\text{Oct 14 to Mar 15 Average Sales - April 14 to Sep 14 Average Sales}}{\text{April 14 to Sep 14 Average Sales}}$$Monthly Sales Performance:
$$\frac{\text{Current Month Sales - Pervious Month Sales}}{\text{Previous Month Sales}}$$Sales Volatility:
$$\frac{\text{Maximum Monthly Sales - Minimum Monthly Sales}}{\text{Average Monthly Sales}}$$What is the closest average number of 11⁄2 ton Window ACs sold by Torrent Enterprises during April 2014 - March 2015?
Performance measures are as follows:
Half Yearly Sales Performance:$$\frac{\text{Oct 14 to Mar 15 Average Sales - April 14 to Sep 14 Average Sales}}{\text{April 14 to Sep 14 Average Sales}}$$Monthly Sales Performance:
$$\frac{\text{Current Month Sales - Pervious Month Sales}}{\text{Previous Month Sales}}$$Sales Volatility:
$$\frac{\text{Maximum Monthly Sales - Minimum Monthly Sales}}{\text{Average Monthly Sales}}$$What is the closest average number of 11⁄2 ton Window ACs sold by Torrent Enterprises during April 2014 - March 2015? Table 2:
 Table 3:
 The number of students who get jobs in finance is less than the students getting marketing jobs, in the 5 years, by
 Average Sales of Product A minus Average Sales of Product B
After taking a print out of the above table, she attempted to look at the trend of sales and plotted a graph in MS Excel. Later she took a print out of the graph and left for a meeting. While on her way she figured out that due to some printer cartridge problem sales of Product A in 2013, Product C in 2010, and Product D in 2012 were not visible in the graph as reproduced below. Anita had to make some quick calculations to arrive at the information outlined in the following question.
Average Sales of Product A minus Average Sales of Product B
After taking a print out of the above table, she attempted to look at the trend of sales and plotted a graph in MS Excel. Later she took a print out of the graph and left for a meeting. While on her way she figured out that due to some printer cartridge problem sales of Product A in 2013, Product C in 2010, and Product D in 2012 were not visible in the graph as reproduced below. Anita had to make some quick calculations to arrive at the information outlined in the following question.
 What are the sales of Product A in 2013, Product C in 2010 and Product D in 2012?