Toggle navigation
Home
Article Category
Question Papers
General Knowlege
Popular Pages
Multiple Choice Question in
Multiple Choice Question in 049
Multiple Choice Question in -current-affairs-2016
Multiple Choice Question in 2016
Multiple Choice Question in TRADES-INSTRUCTOR---GR-II---SMITHY---TECHNICAL-EDUCATION
Question Answer in ASSISTANT-PROFESSOR---COMPUTER-SCIENCE-AND-ENGINEERING---TECHNICAL-EDUCATION
Multiple Choice Question in ASSISTANT-PROFESSOR---COMPUTER-SCIENCE-AND-ENGINEERING---TECHNICAL-EDUCATION
Multiple Choice Question in english
Multiple Choice Question in abbreviations-abbreviations-m
Multiple Choice Question in 072/2016
Multiple Choice Question in SSC CHSL 7 March 2018 Morning Shift
Question Answer Bank
Multiple Choice Question Bank
Question Answer Category
Multiple Choice Question Category
Home
->
Multiple Choice Questions
1. Find the number of squares in the figure:
(A): 27
(B): 25
(C): 24
(D): 26
Previous Question
Show Answer
Next Question
Add Tags
Report Error
Show Marks
Write Comment
Type in
(Press Ctrl+g to toggle between English and the chosen language)
Post reply
Comments
Tags
RRB Group-D 29th oct 2018-shift -2
Show Similar Question And Answers
QA->HOW MANY SQUARES ARE THERE IN A CHESS BOARD....
QA->On November 30, 2014, the Simon Wiesenthal Center reported that a senior Nazi figure who centrally involved in the implementation of the Holocaust had died in Syria around 2010, or four years earlier. Who is that Nazi figure?....
QA->The essential condition for the application of Simpson’s rule to find the area, the number ordinates should be :....
QA->Find the missing number in the series 68,81,96,……….132....
QA->The three-fifth of a number is 40 more than the 40 percent of the same number. The number is :....
MCQ->Find the number of squares in the figure:
....
MCQ->The adjoining figure shows a set of concentric squares. If the diagonal of the innermost square is 2 units, and if the distance between the corresponding corners of any two successive squares is 1 unit, find the difference between the areas of the eighth and the seventh squares, counting from the innermost square.
....
MCQ-> Study the given pie-charts carefully to answer the question that follows Break-up of numbers of employees working in different department of an organisation, the number of males and the number of employees who Recently Got promoted in Each Department Break-up of the employees working in different departments:Total number of employees=3,600
Employees working in different departments
Break-up of Number of Males in Each Department Total number of males in the Organisation = 2,040
Break-up of Number of Males Working in Each Department
Break-up of Number of employees
who recently Got Promoted in each Department Total number of Employees who got promoted = 1,200
Number of Employees who recently Got Promoted from Each Department
If half of the number of employees who got promoted from the IT department were males what was the approximate percentage of males who got promoted from the IT department ?
....
MCQ-> In each of the following questions two rows of number are given. The resultant number in each row is to be worked out separately based on the following rules and the question below the row is to be answered. The operations of number progress from the left to right. Rules: (i) If an even number is followed by another even number they are to be added. (ii) If an even number is followed by a prime number, they are to be multiplied. (iii) If an odd number is followed by an even number, even number is to be subtracted from the odd number. (iv) If an odd number is followed by another odd number the first number is to be added to the square of the second number. (v) If an even number is followed by a composite odd number, the even number is to be divided by odd number.I. 84 21 13 II. 15 11 44 What is half of the sum of the resultants of the two rows ?....
MCQ-> The first table gives the number of saris (of all the eight colours) stocked in six regional showrooms. The second gives the number of saris (of all the eight colours) sold in these six regional showrooms. The third table gives the percentage of saris sold to saris stocked for each colour in each region. The fourth table gives the percentage of saris of a specific colour sold within that region. The fifth table gives the percentage of saris of a specific colour sold across all the regions. Study the tables and for each of the following questions, choose the best alternative.Table 1
Table 2
Table 3
Table 4
Table 5
Which region-colour combination accounts for the highest percentage of sales to stock?
....
×
×
Type The Issue
×
Your Marks
Terms And Service:We do not guarantee the accuracy of available data ..We Provide Information On Public Data.. Please consult an expert before using this data for commercial or personal use
Powered By:Omega Web Solutions
© 2002-2017 Omega Education PVT LTD...
Privacy
|
Terms And Conditions

 Powered By:Omega Web Solutions
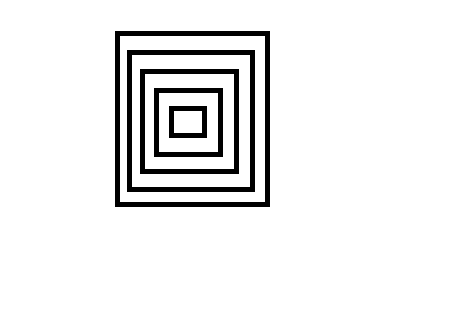 ....
.... Break-up of Number of Males in Each Department
Total number of males in the Organisation = 2,040
Break-up of Number of Males Working in Each Department
Break-up of Number of Males in Each Department
Total number of males in the Organisation = 2,040
Break-up of Number of Males Working in Each Department  Break-up of Number of employees
who recently Got Promoted in each Department
Total number of Employees who got promoted = 1,200
Number of Employees who recently Got Promoted from Each Department
Break-up of Number of employees
who recently Got Promoted in each Department
Total number of Employees who got promoted = 1,200
Number of Employees who recently Got Promoted from Each Department If half of the number of employees who got promoted from the IT department were males what was the approximate percentage of males who got promoted from the IT department ?
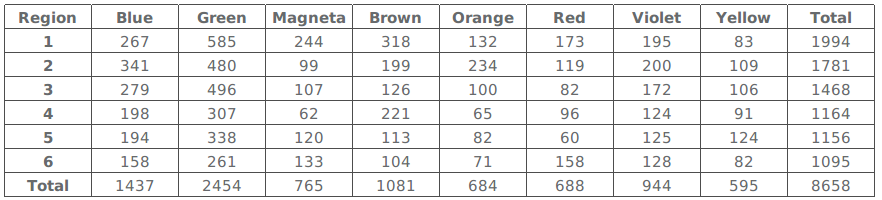 Table 2
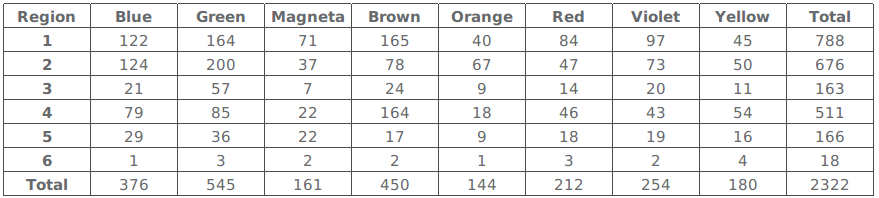 Table 3
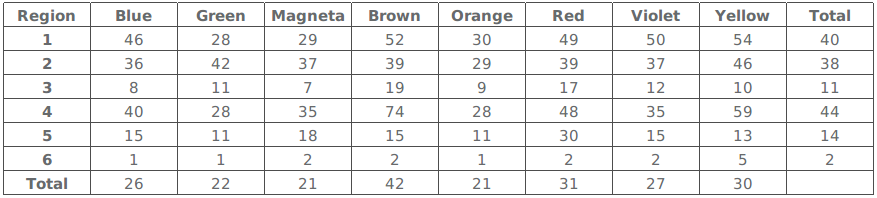 Table 4
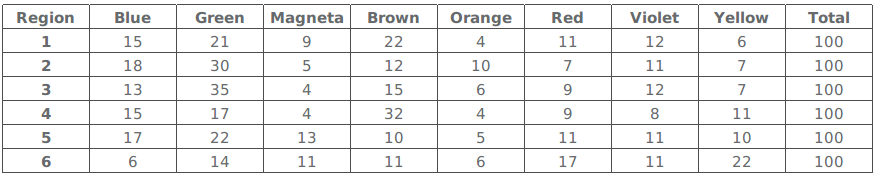 Table 5
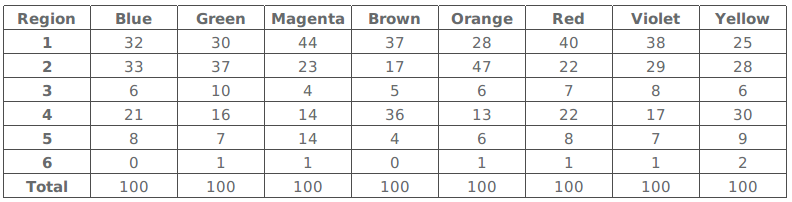 Which region-colour combination accounts for the highest percentage of sales to stock?