1.
Study the following graph and answer the questions that follow
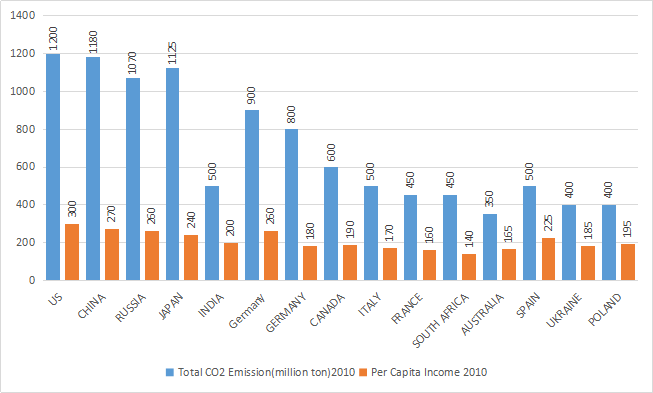 If the world energy council formulates a norm for high emission countries to reduce their emission each year by 12.5% for the next two years then what would be the ratio of $$CO_2$$ emission to per capita income of US, China and Japan after two years. The per capita income of China, Japan and US is expected to increase every year by 4%, 3% and 2% respectively.
Write Comment
Comments
- By: anil on 05 May 2019 02.40 am
Show Similar Question And Answers

Similarly, we can calculate the $$CO_2$$ emission and per capita income for remaining countries after two years from now. $$CO_2$$ emission by the China after 2 years = 903.44 million tons.
The per capita income in China after 2 years = $${(1+dfrac{4}{100})}^2 imes 270$$ = 292.032
$$CO_2$$ emission by the Japan after 2 years = 861.33 million tons.
The per capita income in Japan after 2 years = $${(1+dfrac{3}{100})}^2 imes 240$$ = 254.616
Hence, the required ratio = $$dfrac{918.75}{312.12}$$, $$dfrac{903.44}{292.032}$$, $$dfrac{861.33}{254.616}$$, = 2.9, 3.1, 3.4. Therefore, we can say option C is the correct answer.