1.
Given below are the shares of India’s export basket to different regions (figures in percentage). Answer the questions on the basis of following data.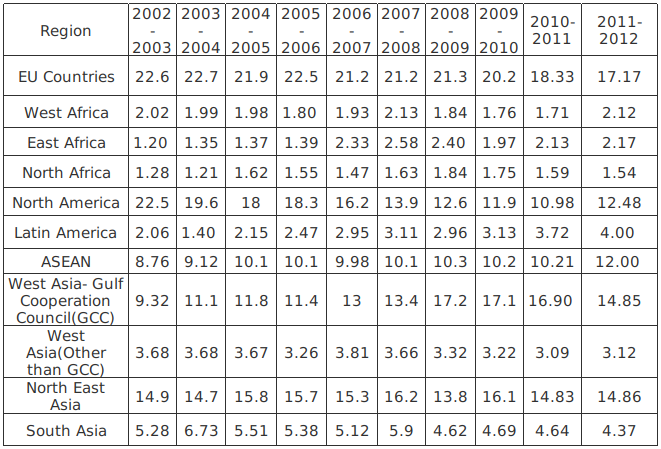 Among the four options mentioned below, export share of India witnessed HIGHEST year-to-year decline in absolute terms in which of the region-period combinations?
Write Comment
Comments
- By: anil on 05 May 2019 02.39 am
Show Similar Question And Answers

A. 10-9.98 = 0.12
B. 5.51-5.38 = 0.13
C. 3.66-3.32 = 0.34
D. 1.75-1.59 = 0.16
Thus, export share of India witnessed HIGHEST year-to-year decline in absolute terms in In West Asia (GCC) region from 2008-09 to 2009-10.
Hence, option C is the correct answer.