1. Mr. Sharma found some printouts of line diagrams. The axes of the graphs were not marked, but Mr. Sharma remembered that he measured monthly output on the x - axis. Which of the following diagrams would represent the estimates of electricity cost per square feet of output versus monthly output?
Show Similar Question And Answers
 Apart from labour and material costs Mulchand Textiles incurs administrative costs of Rs. 40,000 per month, and electricity costs. Mr. Sharma recalled that estimate data of variable electricity cost had certain peculiar characteristics. Values at every 25000 sq ft of output increased in geometric progression till 150000 sq ft of output, after which values increased in arithmetic progression for every 25000 sq ft of output. Mr. Sharma remembered that the electricity cost was estimated to be Rs. 3800 for 25000 sq.ft. of output, Rs. 5700 for 50000 square feet of output and Rs. 38856.50 for 175000 square feet of output.The estimated cost per square feet of output is least for:
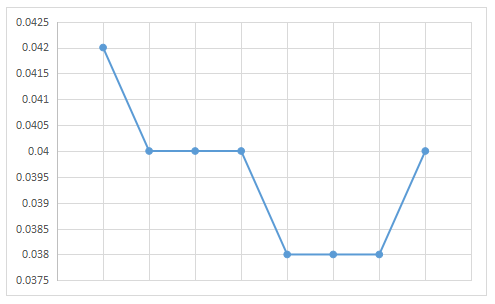 Estimated material usage cost per square feet of output.....