1. Between 2000 and 2010, in terms of gain in vote share which of the following cannot be a possible value (approximated to one decimal place) for any party?


Write Comment

Type in
(Press Ctrl+g to toggle between English and the chosen language)

Comments

Tags
Show Similar Question And Answers
QA->Any industry located in a rural area which produces any goods or renders any service with or without the use of power and in which the fixed capital investment per head of a worker does not exceed one lakh rupees is known as:....
QA->percentage vote share of BJP in 2014 election?....
QA->“It is possible to fail in many ways; while to succeed is possible only in one way”?....
QA->A Share trader who expects the price of share to fall is called a?....
QA->WhichDictionary added 19 Singaporean terms and 13 Hong Kong terms and also includesabout 500 new words and phrases from around the world?....
MCQ-> Read the following passage carefully and answer the questions based on it. Some words have been printed in bold to help you locate them while answering some of the questions.Notwithstanding the fact that the share of household savings to GDS is showing decline, still this segment is the significant contributor to GDS with 70% share. Indian households are among the most frugal in the world However, commensurate capital formation has not been taking place as a lion's share of household savings are being parked in physical assets compared to financial assets. The pattern of disposition of saving is an important factor in determining how the saved amount is utilized for productive purposes. The proportion of household saving in financial assets determines the channelisation of saving for investment in other sectors of the economy. However, the volume of investment of saving in physical assets determines the productivity and generation of income in that sector itself. Post-Independence era has witnessed a significant shift in deployment of household savings especially the share of financial assets increased from 26.39% in 1950 to 54.05% in 1990 may be on account of increased bank branch network across the country coupled with improved awareness of investors on various financial / banking products. However, contrast to common expectations, the share of financial assets in total household savings has come down from 54.05% to 50.21% especially in post reform period i.e. 1990 to 2010 despite providing easy access and availability of banking facilities compared to earlier years. The increased share of physical assets over financial assets (around 4%) during the last two decades is a cause of concern requires focused attention to arrest the trend. Traditionally, the Indians are risk-averse and prefer to invest surplus funds in physical assets such as Gold, Silver and lands. Nevertheless, considerable share of savings also owing to financial assets, which includes, Currency, Bank Deposits, Claims on Government, Contractual Savings, Equities The composition of household financial savings shows that the bank deposits (44%) continue to remain the major contributor along with the rise in the Contractual Savings, Claims on Government and Currency. Though there was gradual decline in currency holdings by the households i.e. 13.79% in 1970s to 9.30% in 2007, still the present currency holding level with households appears to be on high side compared to other countries. The primary reasons for higher currency holdings could be absence of banking facilities in majority villages (5.70 lakh villages)as well as hoarding of unaccounted money in the form of cash to circumvent tax laws. Though, cash is treated as financial asset, in reality, a major portion of currency is blocked and become unproductive. Bank deposits seemed to be the preferred choice mainly on account of its inbuilt features such as Safety, Security and Liquidity. Traditionally, the Household sector has been playing a leading role in the landscape of bank deposits followed by the Government sector. However, the last two decades has witnessed significant shift in ownership of Bank deposits. While there was improvement in Corporate and Government sectors' share by 8.30% and 7.20% respectively during the period 1999 to 2009, household sector lost a share of 13.30% in the post reform period. In the post independence era, Indian financial system was characterized by poor infrastructure and low level of financial deepening. Savings in physical assets constituted the largest portion of the savings compared to the financial assets in the initial years of the planning periods. While rural households were keen on acquiring farm assets, the portfolio of urban households constituted consumer durables, gold, jewellery and house property.Despite the fact that the household savings have been gradually moving from physical assets to financial assets over the years, still 49.79% of household savings are wrapped in unproductive physical assets, which is a cause of concern as the share of physical assets to total savings are very high in the recent years compared to emerging economies. This trend needs to be arrested as scarce funds are being diverted into unproductive segments. Of course, investment in Real estate sector can be treated as productive provided construction activity is commenced within reasonable time, but it is regrettably note that many investors just buy and hold it for speculation leading to unproductive investments. India has probably the largest fascination with gold than any other country in the world with a share of 9.50% of the world's total gold holdings. The World Gold Council believes that they are over 18000 tonnes of gold holding in the country. More impressive is the fact that current demand from India alone consumes 25% of the world's annual gold output. Large amount of capital is blocked in gold which resides in bank lockers and remain unproductive. Indian economy would grow faster if the capital markets could attract more of the nation's savings and channel them into more productive areas, especially infrastructure. If the Indian market can develop and evolve into a more mature financial system, which persuades the middle class to put more of its money into equities, the potential is mind-boggling.Which of the following statement (s) is/are correct in the context of the given passage? I. The GDS percentage to GDP has shown considerable improvement from 10% in 1950 to 33.7% in 2010, which is one of the highest globally. II. The saving rate however shows an increasing trend, marginal decline is observed under tic use hold sector. III. The share of financial assets in total household savings have come down from 54.05% to 21% especially in post reform era.....
MCQ-> Answer the questions on the basis of information given below. Twitter allows its users to post/share and read short messages known as tweets. Tweets can be of three types – Positive Tweets (in support), Negative Tweets (against) and Neutral Tweets. The following table presents the Number of Votes and Tweets received by certain political parties. * 
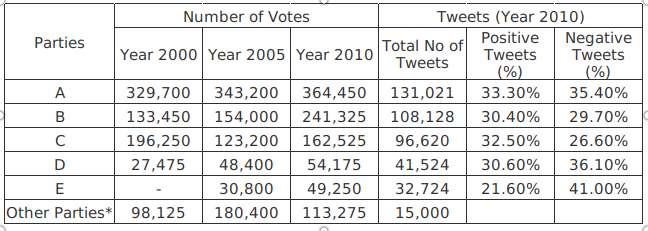
Any party which has secured less than 2% of the total votes falls under ‘Other Parties’ category. For example, Party E secured less than 2% of total votes, in the year 2000. Note: If the vote share (%age of total votes) of a party changes from 15% to 40%, gain in vote share would be 25% (= 40%, – 15%).Which of the following options correctly arranges the political parties in descending order of gain in vote share from the year 2005 to the year 2010?
 ....
MCQ-> The second plan to have to examine is that of giving to each person what she deserves. Many people, especially those who are comfortably off, think this is what happens at present: that the industrious and sober and thrifty are never in want, and that poverty is due to idleness, improvidence, drinking, betting, dishonesty, and bad character generally. They can point to the fact that a labour whose character is bad finds it more difficult to get employment than one whose character is good; that a farmer or country gentleman who gambles and bets heavily, and mortgages his land to live wastefully and extravagantly, is soon reduced to poverty; and that a man of business who is lazy and does not attend to it becomes bankrupt. But this proves nothing that you cannot eat your cake and have it too; it does not prove that your share of the cake was a fair one. It shows that certain vices make us rich. People who are hard, grasping, selfish, cruel, and always ready to take advantage of their neighbours, become very rich if they are clever enough not to overreach themselves. On the other hand, people who are generous, public spirited, friendly, and not always thinking of the main chance, stay poor when they are born poor unless they have extraordinary talents. Also as things are today, some are born poor and others are born with silver spoons in their mouths: that is to say, they are divided into rich and poor before they are old enough to have any character at all. The notion that our present system distributes wealth according to merit, even roughly, may be dismissed at once as ridiculous. Everyone can see that it generally has the contrary effect; it makes a few idle people very rich, and a great many hardworking people very poor.On this, intelligent Lady, your first thought may be that if wealth is not distributed according to merit, it ought to be; and that we should at once set to work to alter our laws so that in future the good people shall be rich in proportion to their goodness and the bad people poor in proportion to their badness. There are several objections to this; but the very first one settles the question for good and all. It is, that the proposal is impossible and impractical. How are you going to measure anyone's merit in money? Choose any pair of human beings you like, male or female, and see whether you can decide how much each of them should have on her or his merits. If you live in the country, take the village blacksmith and the village clergyman, or the village washerwoman and the village schoolmistress, to begin with. At present, the clergyman often gets less pay than the blacksmith; it is only in some villages he gets more. But never mind what they get at present: you are trying whether you can set up a new order of things in which each will get what he deserves. You need not fix a sum of money for them: all you have to do is to settle the proportion between them. Is the blacksmith to have as much as the clergyman? Or twice as much as the clergyman? Or half as much as the clergyman? Or how much more or less? It is no use saying that one ought to have more the other less; you must be prepared to say exactly how much more or less in calculable proportion.Well, think it out. The clergyman has had a college education; but that is not any merit on his part: he owns it to his father; so you cannot allow him anything for that. But through it he is able to read the New Testament in Greek; so that he can do something the blacksmith cannot do. On the other hand, the blacksmith can make a horse-shoe, which the parson cannot. How many verses of the Greek Testament are worth one horse-shoe? You have only to ask the silly question to see that nobody can answer it.Since measuring their merits is no use, why not try to measure their faults? Suppose the blacksmith swears a good deal, and gets drunk occasionally! Everybody in the village knows this; but the parson has to keep his faults to himself. His wife knows them; but she will not tell you what they are if she knows that you intend to cut off some of his pay for them. You know that as he is only a mortal human being, he must have some faults; but you cannot find them out. However, suppose he has some faults he is a snob; that he cares more for sport and fashionable society than for religion! Does that make him as bad as the blacksmith, or twice as bad, or twice and quarter as bad, or only half as bad? In other words, if the blacksmith is to have a shilling, is the parson to have six pence, or five pence and one-third, or two shillings? Clearly these are fools' questions: the moment they bring us down from moral generalities to business particulars it becomes plain to every sensible person that no relation can be established between human qualities, good or bad, and sums of money, large or small.It may seem scandalous that a prize-fighter, for hitting another prize-fighter so hard at Wembley that he fell down and could not rise within ten seconds, received the same sum that was paid to the Archbishop of Canterbury for acting as Primate of the Church of England for nine months; but none of those who cry out against the scandal can express any better in money the difference between the two. Not one of the persons who think that the prize-fighter should get less than the Archbishop can say how much less. What the prize- fighter got for his six or seven months' boxing would pay a judge's salary for two years; and we all agree that nothing could be more ridiculous, and that any system of distributing wealth which leads to such absurdities must be wrong. But to suppose that it could be changed by any possible calculation that an ounce of archbishop of three ounces of judge is worth a pound of prize-fighter would be sillier still. You can find out how many candles are worth a pound of butter in the market on any particular day; but when you try to estimate the worth of human souls the utmost you can say is that they are all of equal value before the throne of God:And that will not help you in the least to settle how much money they should have. You must simply give it up, and admit that distributing money according to merit is beyond mortal measurement and judgement.Which of the following is not a vice attributed to the poor by the rich?
 ....
MCQ->Between 2000 and 2010, in terms of gain in vote share which of the following cannot be a possible value (approximated to one decimal place) for any party?....
MCQ-> Directions : Read the following passage carefully and answer the questions given below it. Following the end of the Second World War, the United Kingdom enjoyed a long period without a major recession (from 1945 - 1973) and a rapid growth in prosperity in the 1959s and 1960s. According to the OECD, the annual rate of growth (percentage change between 1960 and 1973 averaged 2.9%, although this figure was far behind the rates of other European countries such as France, West Germany and Italy. However, following the 1973 oil crisis and the 1973-1974 stock market crash, the British economy fell into recession and the government of Edward Heath was ousted by the Labour Party under Harold Wilson. Wilson formed a minority government on 4 March 1974 after the general election on 28 February ended in a hung parliament. Wilson subsequently secured a three seat majority in a second election in October that year. The UK recorded weaker growth than many other European nations in the 1970s; even after the early 1970s recession ended, the economy was still blighted by rising unemployment and double-digit inflation. In 1976, the UK was forced to request a loan of $ 2.3 billion from the International Monetary Fund. The then Chancellor of the Exchequer Denis Healey was required to implement public spending cuts and other economic reforms in order to secure the loan. Following the Winter of Discontent, the government of James Callaghan lost a vote of no confidence. This triggered the May 1979 general electron which resulted in Margaret Thatcher's Conservative Party forming a new government. A new period of neo-liberal economics began in 1979 with the election of Margaret Thatcher who won the general election on 3 May that year to return the Conservative Party to government after five years of Labour government. During the 1980s most state-owned enterprises were privatised, taxes cut and markets deregulated. GDP fell 5.9 % initially but growth subsequently returned and rose to 5% at its peak in 1988, one of the highest rates of any European nation. The UK economy had been one of the strongest economies in terms of inflation, interest rates and unemployment, all of which remained relatively low until the 2008-09 recession. Unemployment has since reached a peak of just under 2.5 million (7.8 %), the highest level since the early 1990s, although still far lower than some other European nations. However, interest rates have reduced to 0.5 % pa. During August 2008 the IMF warned that the UK economic outlook had worsened due to a twin shock : financial turmoil and rising commodity prices. Both developments harm the UK more than most developed countries, as the UK obtains revenue from exporting financial services while recording deficits in finished goods and commodities, including food. In 2007, the UK had the world's third largest current account deficit, due mainly to a large deficit in manufactured goods. During May 2008, the IMF advised the UK government to broaden the scope of fiscal policy to promote external balance. Although the UK's labour productivity per person employed¡¨ has been progressing well over the last two decades and has overtaken productivity in Germany, it still lags around 20% behind France, where workers have a 35 hour working week. the UK's labour productivity per hour worked is currently on a par with the average for the sold EU (15 countries). In 2010, the United Kingdom ranked 26th on the Human Development Index. The UK entered a recession in Q2 of 2008, according to the Office for National Statics and exited it in Q4 of 2009. The subsequently revised ONS figures show that the UK suffered six consecutive quarters of negative growth, making it the longest recession since records began. As of the end of Q4 2009, revised statistics from the Office for National Statistics demonstrate that the UK economy shrank by 7.2% from peak to trough. The Blue Book 2013 confirms that UK growth in Q2 of 2013 was 0.7 %, and that the volume of output of GDP remains 3.2% below its prerecession peak; The UK economy's recovery has thus been more lackluster than previously thought. Furthermore The Blue Book 2013 demonstrates that the UK experienced a deeper initial downturn than all of the G7 economies save for Japan, and has experienced a slower recovery than all but Italy. A report released by the Office of National Statistics on 14 May 2013 revealed that over the six-year period between 2005 and 2011, the UK dropped from 5th place to 12th place in terms of household income on an international scale ¡X the drop was partially attrib10 uted to the devaluation of sterling over this time frame. However, the report also concluded that, during this period, inflation was relatively less volatile, the UK labour market was more resilient in comparison to other recessions, and household spending and wealth in the UK remained relatively strong in comparison with other OECD countries. According to a report by Moody's Corporation, Britain's debt-to-GDP ratio continues to increase in 2013 and is expected to reach 93% at the end of the year. The UK has lost its triple. A credit rating on the basis of poor economic outlook. 2013 Economic Growth has surprised many Economists, Ministers and the OBR in the 2013 budget projected annual growth of just 0.6 %. In 2013 Q1 the economy grew by 0.4 % Q2 the economy grew by 0.7 % and Q3 the economy is predicted to have grown at 0.8%.A new period of neo-liberal economics began in United Kingdom with the election of Margaret Thatcher after five years of Labour government. Margaret Thatcher came in power in
 ....
Terms And Service:We do not guarantee the accuracy of available data ..We Provide Information On Public Data.. Please consult an expert before using this data for commercial or personal use
DMCA.com Protection Status Powered By:Omega Web Solutions
© 2002-2017 Omega Education PVT LTD...Privacy | Terms And Conditions