1.  In the above table, for suitably chosen constants a, b and c, which one of the following best describes the relation between y and x?
Write Comment
Comments
- By: anil on 05 May 2019 02.31 am
Show Similar Question And Answers
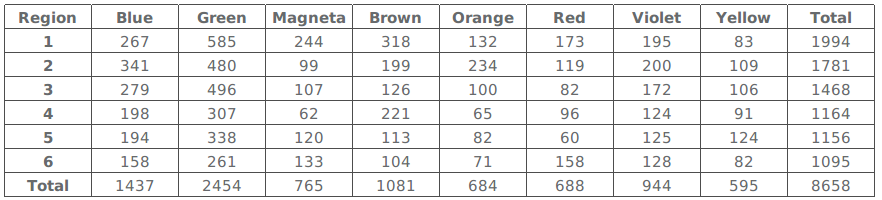 Table 2
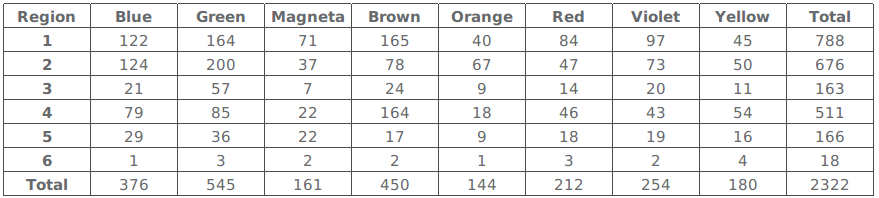 Table 3
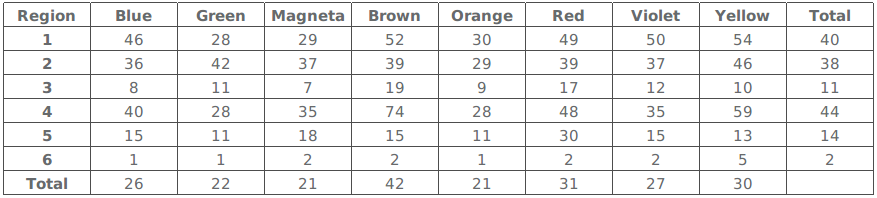 Table 4
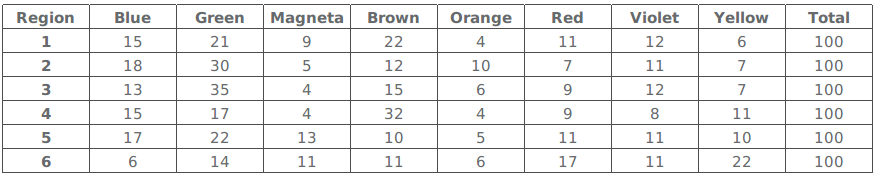 Table 5
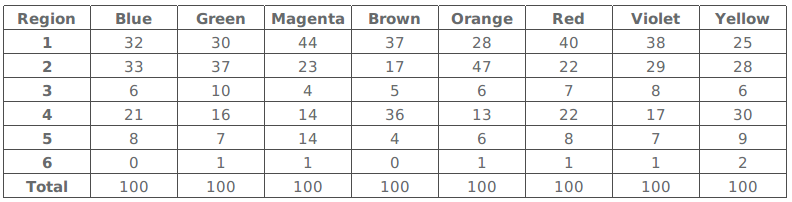 Which region-colour combination accounts for the highest percentage of sales to stock?
 Table 2: Distance between Cities (KM)
 Table 3: Mode of Transport and Cost
 For which of the following options, travel time is the least?
Lets take option B: Suppose $$y=f(x)=a+bx+cx^2$$
f(1)=4 => a+b+c=4 -- (1)
f(2)=8 => a+2b+4c=8 -- (2)
f(3)=14 => a+3b+9c=14 -- (3) Let us solve the equations and see if $$f(4), f(5),f(6)$$ also satisfy the given equation. (2)-(1) => b+3c=4
(3)-(2) => b+5c=6
This gives c=1 and b=1 ==> a=2 So, $$f(x)=2+x+x^2$$
$$f(4)=2+4+4^2 = 22$$
$$f(5)=2+5+5^2 = 32$$
$$f(6)=2+6+6^2 = 44$$
As all the three also satisfy the numbers given in the table, it can be inferred that the relationship between x and y is quadratic and the correct option is option (b)