1. In a silk sari showroom there are 10 exclusive and highly expensive saris- 3 of Kalamkari, 3 Ikat, 2 Kanchi and 2 Banaras, are arranged in a shelf from top to bottom as follows; There is a Banaras sari between a Kalamkari and Kanchi sari, A Kalamkari sari between a Kanchi and an Banaras sari. A Ikat sari between a Banaras and a Kanchi sari, A Kanchi sari between two Ikat saris and Two Ikat saris between a Kanchi and a Kalamkari sari. Which type of sari is present in that arrangement in 6th place from top?
Show Similar Question And Answers
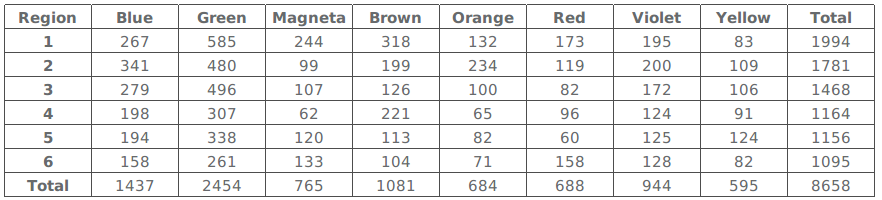 Table 2
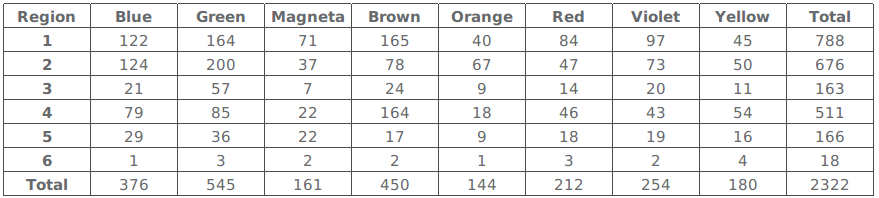 Table 3
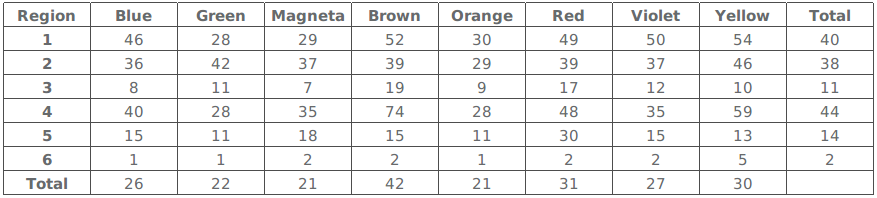 Table 4
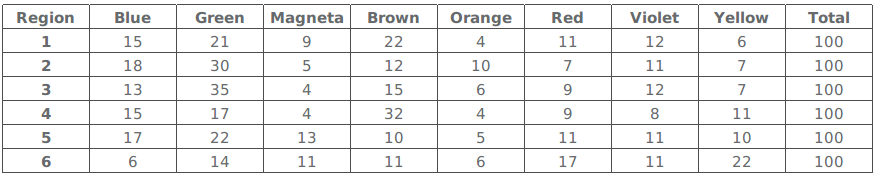 Table 5
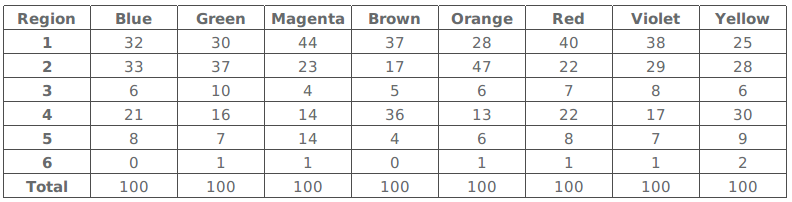 Which region-colour combination accounts for the highest percentage of sales to stock?
 Source: 92.825 US mobile users, July 2012 - January 2013
Fortunately, those questions were answered by OnDevice Research’s representative. He explained that the survey was conducted on mobile web where the survey software could detect the taker’s device and since user’s rate their satisfaction levels on a 1 to 10 scale, thanks to the Nexus device, Google was included.If you analyze the three reports above, which of the following statements would be the best inference?
Source: 92.825 US mobile users, July 2012 - January 2013
Fortunately, those questions were answered by OnDevice Research’s representative. He explained that the survey was conducted on mobile web where the survey software could detect the taker’s device and since user’s rate their satisfaction levels on a 1 to 10 scale, thanks to the Nexus device, Google was included.If you analyze the three reports above, which of the following statements would be the best inference?