1. Read the given data and answer the questions ?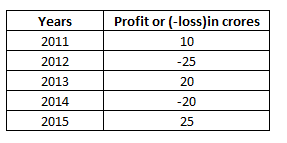 What was the total profit or loss in last 5 years?
Write Comment
Comments
- By: anil on 05 May 2019 02.12 amTotal profit or loss in Rs. crore in last 5 years = 10 - 25 + 20 - 20 + 25 = 10 Since, it is positive, thus profit of Rs. 10 crore => Ans - (A)
Show Similar Question And Answers
