1. Refer the below data and table answer the following questions
 How many car were manufactured in the month of April and May ?
Write Comment
Comments
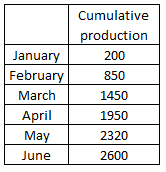
- By: anil on 05 May 2019 02.10 amNumber of cars produced in : January = 200 February = 850 - 200 = 650 March = 1450 - 850 = 600 April = 1950 - 1450 = 500 May = 2320 - 1950 = 370 June = 2600 - 2320 = 280 => Number of cars that were manufactured in the month of the April and may = 500 + 370 = 870 => Ans - (D)
Show Similar Question And Answers
 Table B
 Performance measures are as follows:
Half Yearly Sales Performance:$$\frac{\text{Oct 14 to Mar 15 Average Sales - April 14 to Sep 14 Average Sales}}{\text{April 14 to Sep 14 Average Sales}}$$Monthly Sales Performance:
$$\frac{\text{Current Month Sales - Pervious Month Sales}}{\text{Previous Month Sales}}$$Sales Volatility:
$$\frac{\text{Maximum Monthly Sales - Minimum Monthly Sales}}{\text{Average Monthly Sales}}$$What is the closest average number of 11⁄2 ton Window ACs sold by Torrent Enterprises during April 2014 - March 2015?
Performance measures are as follows:
Half Yearly Sales Performance:$$\frac{\text{Oct 14 to Mar 15 Average Sales - April 14 to Sep 14 Average Sales}}{\text{April 14 to Sep 14 Average Sales}}$$Monthly Sales Performance:
$$\frac{\text{Current Month Sales - Pervious Month Sales}}{\text{Previous Month Sales}}$$Sales Volatility:
$$\frac{\text{Maximum Monthly Sales - Minimum Monthly Sales}}{\text{Average Monthly Sales}}$$What is the closest average number of 11⁄2 ton Window ACs sold by Torrent Enterprises during April 2014 - March 2015?