1.
The line graph shows the number of deaths due to rail accidents in a certain state. Study the diagram and answer the following questions.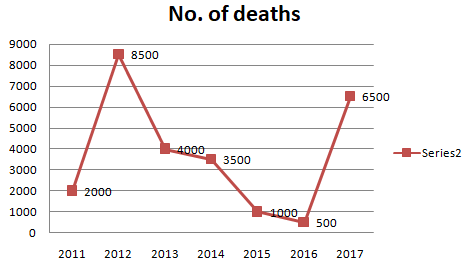 Year In which year were the number of deaths greater than that of the previous year ?
Write Comment
Comments
- By: anil on 05 May 2019 02.06 amIn 2012 and 2017, the number of deaths were greater than that of the previous year. => Ans - (B)
Show Similar Question And Answers
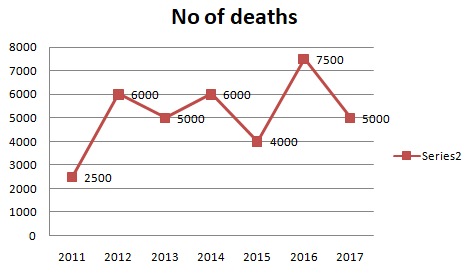 YearIn which year were the number of deaths lesser than that of the previous year?