Toggle navigation
Home
Article Category
Question Papers
General Knowlege
Popular Pages
Multiple Choice Question in 049
Multiple Choice Question in
Multiple Choice Question in 2016
Multiple Choice Question in TRADES-INSTRUCTOR---GR-II---SMITHY---TECHNICAL-EDUCATION
Multiple Choice Question in -current-affairs-2016
Question Answer in ASSISTANT-PROFESSOR---COMPUTER-SCIENCE-AND-ENGINEERING---TECHNICAL-EDUCATION
Multiple Choice Question in ASSISTANT-PROFESSOR---COMPUTER-SCIENCE-AND-ENGINEERING---TECHNICAL-EDUCATION
Multiple Choice Question in english
Multiple Choice Question in abbreviations-abbreviations-m
Multiple Choice Question in SSC CHSL 7 March 2018 Morning Shift
Multiple Choice Question in 072/2016
Question Answer Bank
Multiple Choice Question Bank
Question Answer Category
Multiple Choice Question Category
Home
->
Multiple Choice Questions
1. The percentage of the total production of flavour R in 2007 and 2008 with respect to the production of flavour P in 2005 and 2006 is :
(A): 102.25%
(B): 115.35%
(C): 133.33%
(D): 97.67%
Previous Question
Show Answer
Next Question
Add Tags
Report Error
Show Marks
Write Comment
Type in
(Press Ctrl+g to toggle between English and the chosen language)
Post reply
Comments
Tags
SSC CGL 2013 Tier 1 21 April Morning Shift
Show Similar Question And Answers
QA->If an officer is appointed to hold full charge of another post in addition to his own, he will be eligible for special allowance as a percentage of the minimum of the scale of pay of that post. This percentage shall not exceed:....
QA->If an officer is appointed to discharge the current duties of another post in addition to his own, he will be eligible for a special allowance as a percentage of the minimum of the scale of pay of the additional post. This percentage shall not exceed:....
QA->Novell recently purchased the ……..flavour of Linux.....
QA->Forest policy of govt. aims to bring what percentage of total area; under forest?....
QA->What percentage of country’s demand for natural rubber is met by in indigenous production?....
MCQ->The percentage of the total production of flavour R in 2007 and 2008 with respect to the production of flavour P in 2005 and 2006 is :....
MCQ->What is the difference between the average production of flavour Q in 2008. 2009 and 2010 from that of flavour P in 2005, 2006 and 2007 in lakh bottles is :....
MCQ-> Directions for the following four questions:Answer the following questions based on the information given below.The following table shows the break-up of actual costs incurred by a company in last five years (year 2002 to year 2006) to produce a particular product.
The production capacity of the company is 2000 units. The selling price for the year 2006 was Rs. 125 per unit. Some costs change almost in direct proportion to the change in volume of production, while others do not follow any obvious pattern of change with respect to the volume of production and hence are considered fixed. Using the information provided for the year 2006 as the basis for projecting the figures for the year 2007, answer the following questions:What is the approximate cost per unit in rupees, if the company produces and sells 1400 units in the year 2007?
....
MCQ-> Directions : Read the following passage carefully and answer the questions given below it. Following the end of the Second World War, the United Kingdom enjoyed a long period without a major recession (from 1945 - 1973) and a rapid growth in prosperity in the 1959s and 1960s. According to the OECD, the annual rate of growth (percentage change between 1960 and 1973 averaged 2.9%, although this figure was far behind the rates of other European countries such as France, West Germany and Italy. However, following the 1973 oil crisis and the 1973-1974 stock market crash, the British economy fell into recession and the government of Edward Heath was ousted by the Labour Party under Harold Wilson. Wilson formed a minority government on 4 March 1974 after the general election on 28 February ended in a hung parliament. Wilson subsequently secured a three seat majority in a second election in October that year. The UK recorded weaker growth than many other European nations in the 1970s; even after the early 1970s recession ended, the economy was still blighted by rising unemployment and double-digit inflation. In 1976, the UK was forced to request a loan of $ 2.3 billion from the International Monetary Fund. The then Chancellor of the Exchequer Denis Healey was required to implement public spending cuts and other economic reforms in order to secure the loan. Following the Winter of Discontent, the government of James Callaghan lost a vote of no confidence. This triggered the May 1979 general electron which resulted in Margaret Thatcher's Conservative Party forming a new government. A new period of neo-liberal economics began in 1979 with the election of Margaret Thatcher who won the general election on 3 May that year to return the Conservative Party to government after five years of Labour government. During the 1980s most state-owned enterprises were privatised, taxes cut and markets deregulated. GDP fell 5.9 % initially but growth subsequently returned and rose to 5% at its peak in 1988, one of the highest rates of any European nation. The UK economy had been one of the strongest economies in terms of inflation, interest rates and unemployment, all of which remained relatively low until the 2008-09 recession. Unemployment has since reached a peak of just under 2.5 million (7.8 %), the highest level since the early 1990s, although still far lower than some other European nations. However, interest rates have reduced to 0.5 % pa. During August 2008 the IMF warned that the UK economic outlook had worsened due to a twin shock : financial turmoil and rising commodity prices. Both developments harm the UK more than most developed countries, as the UK obtains revenue from exporting financial services while recording deficits in finished goods and commodities, including food. In 2007, the UK had the world's third largest current account deficit, due mainly to a large deficit in manufactured goods. During May 2008, the IMF advised the UK government to broaden the scope of fiscal policy to promote external balance. Although the UK's labour productivity per person employed¡¨ has been progressing well over the last two decades and has overtaken productivity in Germany, it still lags around 20% behind France, where workers have a 35 hour working week. the UK's labour productivity per hour worked is currently on a par with the average for the sold EU (15 countries). In 2010, the United Kingdom ranked 26th on the Human Development Index. The UK entered a recession in Q2 of 2008, according to the Office for National Statics and exited it in Q4 of 2009. The subsequently revised ONS figures show that the UK suffered six consecutive quarters of negative growth, making it the longest recession since records began. As of the end of Q4 2009, revised statistics from the Office for National Statistics demonstrate that the UK economy shrank by 7.2% from peak to trough. The Blue Book 2013 confirms that UK growth in Q2 of 2013 was 0.7 %, and that the volume of output of GDP remains 3.2% below its prerecession peak; The UK economy's recovery has thus been more lackluster than previously thought. Furthermore The Blue Book 2013 demonstrates that the UK experienced a deeper initial downturn than all of the G7 economies save for Japan, and has experienced a slower recovery than all but Italy. A report released by the Office of National Statistics on 14 May 2013 revealed that over the six-year period between 2005 and 2011, the UK dropped from 5th place to 12th place in terms of household income on an international scale ¡X the drop was partially attrib10 uted to the devaluation of sterling over this time frame. However, the report also concluded that, during this period, inflation was relatively less volatile, the UK labour market was more resilient in comparison to other recessions, and household spending and wealth in the UK remained relatively strong in comparison with other OECD countries. According to a report by Moody's Corporation, Britain's debt-to-GDP ratio continues to increase in 2013 and is expected to reach 93% at the end of the year. The UK has lost its triple. A credit rating on the basis of poor economic outlook. 2013 Economic Growth has surprised many Economists, Ministers and the OBR in the 2013 budget projected annual growth of just 0.6 %. In 2013 Q1 the economy grew by 0.4 % Q2 the economy grew by 0.7 % and Q3 the economy is predicted to have grown at 0.8%.A new period of neo-liberal economics began in United Kingdom with the election of Margaret Thatcher after five years of Labour government. Margaret Thatcher came in power in
....
MCQ-> Directions : In the following questions, choose the word/group of words which is MOST SIMILAR in meaning to the word / group of words printed in BOLD as used in the passage. Following the end of the Second World War, the United Kingdom enjoyed a long period without a major recession (from 1945 - 1973) and a rapid growth in prosperity in the 1959s and 1960s. According to the OECD, the annual rate of growth (percentage change between 1960 and 1973 averaged 2.9%, although this figure was far behind the rates of other European countries such as France, West Germany and Italy. However, following the 1973 oil crisis and the 1973-1974 stock market crash, the British economy fell into recession and the government of Edward Heath was ousted by the Labour Party under Harold Wilson. Wilson formed a minority government on 4 March 1974 after the general election on 28 February ended in a hung parliament. Wilson subsequently secured a three seat majority in a second election in October that year. The UK recorded weaker growth than many other European nations in the 1970s; even after the early 1970s recession ended, the economy was still blighted by rising unemployment and double-digit inflation. In 1976, the UK was forced to request a loan of $ 2.3 billion from the International Monetary Fund. The then Chancellor of the Exchequer Denis Healey was required to implement public spending cuts and other economic reforms in order to secure the loan. Following the Winter of Discontent, the government of James Callaghan lost a vote of no confidence. This triggered the May 1979 general electron which resulted in Margaret Thatcher's Conservative Party forming a new government. A new period of neo-liberal economics began in 1979 with the election of Margaret Thatcher who won the general election on 3 May that year to return the Conservative Party to government after five years of Labour government. During the 1980s most state-owned enterprises were privatised, taxes cut and markets deregulated. GDP fell 5.9 % initially but growth subsequently returned and rose to 5% at its peak in 1988, one of the highest rates of any European nation. The UK economy had been one of the strongest economies in terms of inflation, interest rates and unemployment, all of which remained relatively low until the 2008-09 recession. Unemployment has since reached a peak of just under 2.5 million (7.8 %), the highest level since the early 1990s, although still far lower than some other European nations. However, interest rates have reduced to 0.5 % pa. During August 2008 the IMF warned that the UK economic outlook had worsened due to a twin shock : financial turmoil and rising commodity prices. Both developments harm the UK more than most developed countries, as the UK obtains revenue from exporting financial services while recording deficits in finished goods and commodities, including food. In 2007, the UK had the world's third largest current account deficit, due mainly to a large deficit in manufactured goods. During May 2008, the IMF advised the UK government to
Broaden
the scope of fiscal policy to promote external balance. Although the UK's labour productivity per person employed¡¨ has been progressing well over the last two decades and has overtaken productivity in Germany, it still lags around 20% behind France, where workers have a 35 hour working week. the UK's labour productivity per hour worked is currently
on a par
with the average for the sold EU (15 countries). In 2010, the United Kingdom ranked 26th on the Human Development Index. The UK entered a recession in Q2 of 2008, according to the Office for National Statics and exited it in Q4 of 2009. The subsequently revised ONS figures show that the UK suffered six consecutive quarters of negative growth, making it the longest recession since records began. As of the end of Q4 2009, revised statistics from the Office for National Statistics demonstrate that the UK economy shrank by 7.2% from peak to trough. The Blue Book 2013 confirms that UK growth in Q2 of 2013 was 0.7 %, and that the volume of output of GDP remains 3.2% below its prerecession peak; The UK economy's recovery has thus been more lackluster than previously thought. Furthermore The Blue Book 2013 demonstrates that the UK experienced a deeper initial downturn than all of the G7 economies save for Japan, and has experienced a slower recovery than all but Italy. A report released by the Office of National Statistics on 14 May 2013 revealed that over the six-year period between 2005 and 2011, the UK dropped from 5th place to 12th place in terms of household income on an international scale ¡X the drop was partially attrib10 uted to the devaluation of sterling over this time frame. However, the report also concluded that, during this period, inflation was relatively less volatile, the UK labour market was more resilient in comparison to other recessions, and household spending and wealth in the UK remained relatively strong in comparison with other OECD countries. According to a report by Moody's Corporation, Britain's debt-to-GDP ratio continues to increase in 2013 and is expected to reach 93% at the end of the year. The UK has lost its triple. A credit rating on the basis of poor economic outlook. 2013 Economic Growth has surprised many Economists, Ministers and the OBR in the 2013 budget projected annual growth of just 0.6 %. In 2013 Q1 the economy grew by 0.4 % Q2 the economy grew by 0.7 % and Q3 the economy is predicted to have grown at 0.8%.bBroaden
....
×
×
Type The Issue
×
Your Marks
Terms And Service:We do not guarantee the accuracy of available data ..We Provide Information On Public Data.. Please consult an expert before using this data for commercial or personal use
Powered By:Omega Web Solutions
© 2002-2017 Omega Education PVT LTD...
Privacy
|
Terms And Conditions
 Powered By:Omega Web Solutions
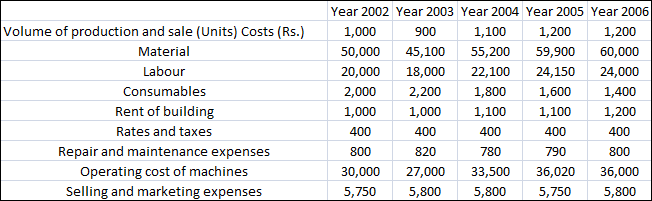 The production capacity of the company is 2000 units. The selling price for the year 2006 was Rs. 125 per unit. Some costs change almost in direct proportion to the change in volume of production, while others do not follow any obvious pattern of change with respect to the volume of production and hence are considered fixed. Using the information provided for the year 2006 as the basis for projecting the figures for the year 2007, answer the following questions:What is the approximate cost per unit in rupees, if the company produces and sells 1400 units in the year 2007?