1.
The bar graph shows the population density of 6 countries. Study the diagram and answer the following questions.
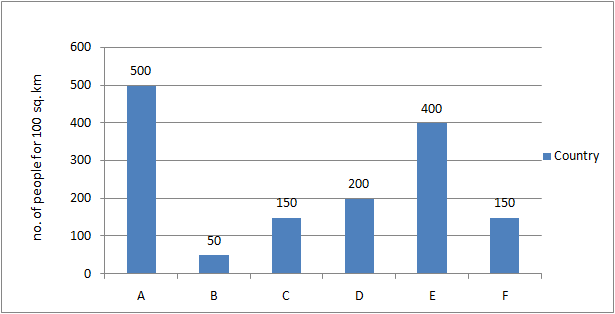 What is the ratio of the population densities of country C to country D?
Write Comment
Comments
- By: anil on 05 May 2019 01.45 amC : D = 150 : 200 = 3 : 4 So the answer is option A.
Show Similar Question And Answers
