1.
Read the following graph and answer the questions below
The diagram below shows the enrolment of students in a school in different years, from 2014 to 2017. The total number of students enrolled in the years 2014, 2016, 2017 put together is
Show Similar Question And Answers
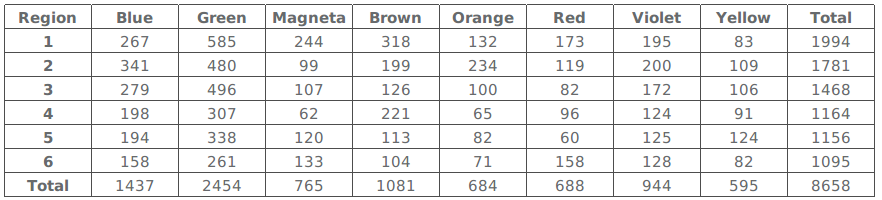 Table 2
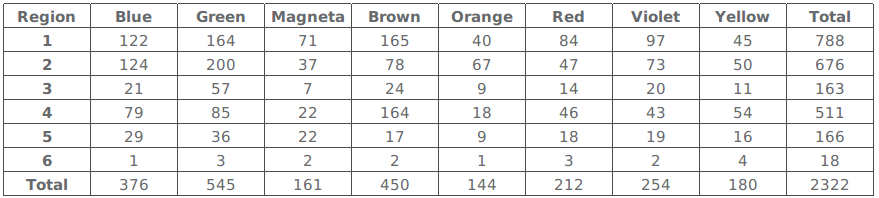 Table 3
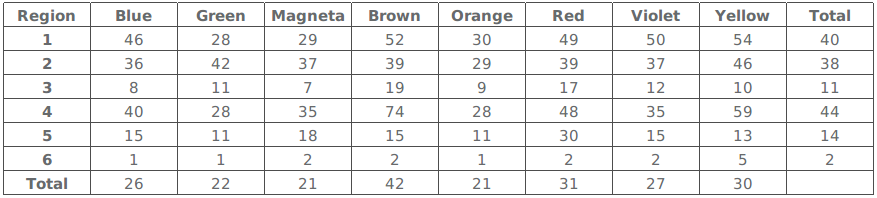 Table 4
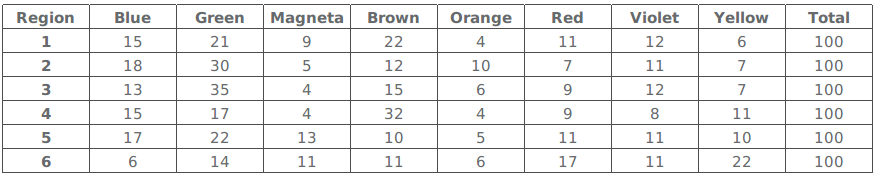 Table 5
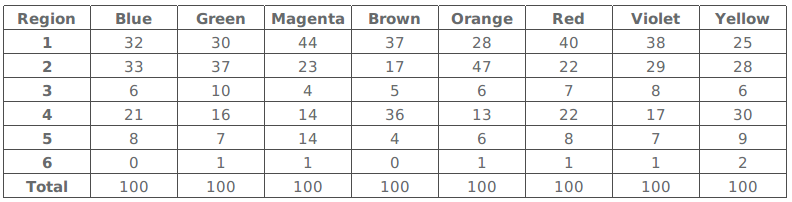 Which region-colour combination accounts for the highest percentage of sales to stock?