1. Which of the following statement (s) is/are true in regard to the data compiled by the OECD ? I. The 34 member countries of OECD had 2111 fully or majority owned stateowned enterprises (SOEs) II. In these SOEs there were 5.9 million employees at the end of 2012. III. The combined value of these SOEs is estimated at $ 2.2 trillion, roughly the same size as the global hedge-fund industry.


Write Comment

Type in
(Press Ctrl+g to toggle between English and the chosen language)

Comments

Show Similar Question And Answers
QA->Name the spacecraft of NASA which is nearing the end of its nine-year voyage to Pluto, with just over 100 million miles (160 million kilometers) to go before reaching there in July 20145?....
QA->India’s second-largest public sector lender which plans to buy a majority stake in Dana Bank, bank in Kazakhstan, for an estimated $24 million, which would be its first overseas acquisition?....
QA->In November 2009, more than 50 employees of a nuclear plant of India were affected due to high radiation levels. A water cooler for supplying water for the employees was contaminated with tritiated water. Where is that nuclear plant?....
QA->Who is duty bound to get bank/treasury statement at the end of each month and to confirm that remittances have been fully credited?....
QA->Austrian skydiver who set the world record for skydiving an estimated 39 kilometres (24 miles), reaching an estimated speed of 64 km/h (6 mph), on 14 October 2012?....
MCQ-> Read the following passage carefully and answer the questions given below it. Certain words/phrases have been printed in bold to help you locate them while answering some of the questions. The past quarter of a century has seen several bursts of selling by the world’s governments, mostly but not always in benign market conditions. Those in the OECD, a rich-country club, divested plenty of stuff in the 20 years before the global financial crisis. The first privatisation wave, which built up from the mid-1980s and peaked in 2000, was largely European. The drive to cut state intervention under Margaret Thatcher in Britain soon spread to the continent. The movement gathered pace after 1991, when eastern Europe put thousands of rusting state-owned enterprises (SOEs) on the block. A second wave came in the mid-2000s, as European economies sought to cash in on buoyant markets. But activity in OECD countries slowed sharply as the financial crisis began. In fact, it reversed. Bailouts of failing banks and companies have contributed to a dramatic increase in government purchases of corporate equity during the past five years. A more lasting fea ture is the expansion of the state capitalism practised by China and other emerging economic powers. Governments have actually bought more equity than they have sold in most years since 2007, though sales far exceeded purchases in 2013. Today privatisation is once again “alive and well”, says William Megginson of the Michael Price College of Business at the University of Oklahoma. According to a global tally he recently completed, 2012 was the third-best year ever, and preliminary evidence suggests that 2013 may have been better. However, the geography of sell-offs has changed, with emerging markets now to the fore. China, for instance, has been selling minority stakes in banking, energy, engineering and broadcasting; Brazil is selling airports to help finance a $20 billion investment programme. Eleven of the 20 largest IPOs between 2005 and 2013 were sales of minority stakes by SOEs, mostly in developing countries. By contrast, state-owned assets are now “the forgotten side of the balance-sheet” in many advanced economies, says Dag Detter, managing partner of Whetstone Solutions, an adviser to governments on asset restructuring. They shouldn’t be. Governments of OECD countries still oversee vast piles of assets, from banks and utilities to buildings, land and the riches beneath (see table). Selling some of these holdings could work wonders: reduce debt, finance infrastructure, boost economic efficiency. But governments often barely grasp the value locked up in them. The picture is clearest for companies or company-like entities held by central governments. According to data compiled by the OECD and published on its website, its 34 member countries had 2,111 fully or majority-owned SOEs, with 5.9m employees, at the end of 2012. Their combined value (allowing for some but not all pension-fund liabilities) is estimated at $2.2 trillion, roughly the same size as the global hedge-fund industry. Most are in network industries such as telecoms, electricity and transport. In addition, many countries have large minority stakes in listed firms. Those in which they hold a stake of between 10% and 50% have a combined market value of $890 billion and employ 2.9m people. The data are far from perfect. The quality of reporting varies widely, as do definitions of what counts as a state-owned company: most include only centralgovernment holdings. If all assets held at sub-national level, such as local water companies, were included, the total value could be more than $4 trillion. Reckons Hans Christiansen, an OECD economist. Moreover, his team has had to extrapolate because some QECD members, including America and Japan, provide patchy data. America is apparently so queasy about discussions of public ownership of -commercial assets that the Treasury takes no part in the OECD’s working group on the issue, even though it has vast holdings, from Amtrak and the 520,000-employee Postal Service to power generators and airports. The club’s efforts to calculate the value that SOEs add to, or subtract from, economies were abandoned after several countries, including America, refused to co-operate. Privatisation has begun picking up again recently in the OECD for a variety of reasons. Britain’s Conservative-led coalition is fbcused on (some would say obsessed with) reducing the public debt-to-GDP ratio. Having recently sold the Royal Mail through a public offering, it is hoping to offload other assets, including its stake in URENCO, a uranium enricher, and its student-loan portfolio. From January 8th, under a new Treasury scheme, members of the public and businesses will be allowed to buy government land and buildings on the open market. A website will shortly be set up to help potential buyers see which bits of the government’s /..337 billion-worth of holdings ($527 billion at today’s rate, accounting for 40% of developable sites round Britain) might be surplus. The government, said the chief treasury secretary, Danny Alexander, “should not act as some kind of compulsive hoarder”. Japan has different reasons to revive sell-offs, such as to finance reconstruction after its devastating earthquake and tsunami in 2011. Eyes are once again turning to Japan Post, a giant postal-to-financial-services conglomerate whose oftpostponed partial sale could at last happen in 2015 and raise (Yen) 4 trillion ($40 billion) or more. Australia wants to sell financial, postal and aviation assets to offset the fall in revenues caused by the commodities slowdown. In almost all the countries of Europe, privatisation is likely “to surprise on the upside” as long as markets continue to mend, reckons Mr Megginson. Mr Christiansen expects to see three main areas of activity in coming years. First will be the resumption of partial sell-offs in industries such as telecoms, transport and utilities. Many residual stakes in partly privatised firms could be sold down further. France, for instance, still has hefty stakes in GDF SUEZ, Renault, Thales and Orange. The government of Francois Hollande may be ideologically opposed to privatisation, but it is hoping to reduce industrial stakes to raise funds for livelier sectors, such as broadband and health. The second area of growth should be in eastern Europe, where hundreds of large firms, including manufacturers, remain in state hands. Poland will sell down its stakes in listed firms to make up for an expected reduction in EU structural funds. And the third area is the reprivatisation of financial institutions rescued during the crisis. This process is under way: the largest privatisation in 2012 was the $18 billion offering of America’s residual stake in AIG, an insurance company.Which of the following statements is not true in the context of the given passage ?
 ....
MCQ->Which of the following statement (s) is/are true in regard to the data compiled by the OECD ? I. The 34 member countries of OECD had 2111 fully or majority owned stateowned enterprises (SOEs) II. In these SOEs there were 5.9 million employees at the end of 2012. III. The combined value of these SOEs is estimated at $ 2.2 trillion, roughly the same size as the global hedge-fund industry.....
MCQ-> Before the internet, one of the most rapid changes to the global economy and trade was wrought by something so blatantly useful that it is hard to imagine a struggle to get it adopted: the shipping container. In the early 1960s, before the standard container became ubiquitous, freight costs were I0 per cent of the value of US imports, about the same barrier to trade as the average official government import tariff. Yet in a journey that went halfway round the world, half of those costs could be incurred in two ten-mile movements through the ports at either end. The predominant ‘break-bulk’ method, where each shipment was individually split up into loads that could be handled by a team of dockers, was vastly complex and labour-intensive. Ships could take weeks or months to load, as a huge variety of cargoes of different weights, shapes and sizes had to be stacked together by hand. Indeed, one of the most unreliable aspects of such a labour-intensive process was the labour. Ports, like mines, were frequently seething pits of industrial unrest. Irregular work on one side combined with what was often a tight-knit, well - organized labour community on the other.In 1956, loading break-bulk cargo cost $5.83 per ton. The entrepreneurial genius who saw the possibilities for standardized container shipping, Malcolm McLean, floated his first containerized ship in that year and claimed to be able to shift cargo for 15.8 cents a ton. Boxes of the same size that could be loaded by crane and neatly stacked were much faster to load. Moreover, carrying cargo in a standard container would allow it to be shifted between truck, train and ship without having to be repacked each time.But between McLean’s container and the standardization of the global market were an array of formidable obstacles. They began at home in the US with the official Interstate Commerce Commission, which could prevent price competition by setting rates for freight haulage by route and commodity, and the powerful International Longshoremen's Association (ILA) labour union. More broadly, the biggest hurdle was achieving what economists call ‘network effects’: the benefit of a standard technology rises exponentially as more people use it. To dominate world trade, containers had to be easily interchangeable between different shipping lines, ports, trucks and railcars. And to maximize efficiency, they all needed to be the same size. The adoption of a network technology often involves overcoming the resistance of those who are heavily invested in the old system. And while the efficiency gains are clear to see, there are very obvious losers as well as winners. For containerization, perhaps the most spectacular example was the demise of New York City as a port.In the early I950s, New York handled a third of US seaborne trade in manufactured goods. But it was woefully inefficient, even with existing break-bulk technology: 283 piers, 98 of which were able to handle ocean-going ships, jutted out into the river from Brooklyn and Manhattan. Trucks bound‘ for the docks had to fiive through the crowded, narrow streets of Manhattan, wait for an hour or two before even entering a pier, and then undergo a laborious two-stage process in which the goods foot were fithr unloaded into a transit shed and then loaded onto a ship. ‘Public loader’ work gangs held exclusive rights to load and unload on a particular pier, a power in effect granted by the ILA, which enforced its monopoly with sabotage and violence against than competitors. The ILA fought ferociously against containerization, correctly foreseeing that it would destroy their privileged position as bandits controlling the mountain pass. On this occasion, bypassing them simply involved going across the river. A container port was built in New Jersey, where a 1500-foot wharf allowed ships to dock parallel to shore and containers to be lified on and off by crane. Between 1963 - 4 and 1975 - 6, the number of days worked by longshoremen in Manhattan went from 1.4 million to 127,041.Containers rapidly captured the transatlantic market, and then the growing trade with Asia. The effect of containerization is hard to see immediately in freight rates, since the oil price hikes of the 1970s kept them high, but the speed with which shippers adopted; containerization made it clear it brought big benefits of efficiency and cost. The extraordinary growth of the Asian tiger economies of Singapore, Taiwan, Korea and Hong Kong, which based their development strategy on exports, was greatly helped by the container trade that quickly built up between the US and east Asia. Ocean-borne exports from South Korea were 2.9 million tons in 1969 and 6 million in 1973, and its exports to the US tripled.But the new technology did not get adopted all on its own. It needed a couple of pushes from government - both, as it happens, largely to do with the military. As far as the ships were concerned, the same link between the merchant and military navy that had inspired the Navigation Acts in seventeenth-century England endured into twentieth-century America. The government's first helping hand was to give a spur to the system by adopting it to transport military cargo. The US armed forces, seeing the efficiency of the system, started contracting McLean’s company Pan-Atlantic, later renamed Sea-land, to carry equipment to the quarter of a million American soldiers stationed in Western Europe. One of the few benefits of America's misadventure in Vietnam was a rapid expansion of containerization. Because war involves massive movements of men and material, it is often armies that pioneer new techniques in supply chains.The government’s other role was in banging heads together sufficiently to get all companies to accept the same size container. Standard sizes were essential to deliver the economies of scale that came from interchangeability - which, as far as the military was concerned, was vital if the ships had to be commandeered in case war broke out. This was a significant problem to overcome, not least because all the companies that had started using the container had settled on different sizes. Pan- Atlantic used 35- foot containers, because that was the maximum size allowed on the highways in its home base in New Jersey. Another of the big shipping companies, Matson Navigation, used a 24-foot container since its biggest trade was in canned pineapple from Hawaii, and a container bigger than that would have been too heavy for a crane to lift. Grace Line, which largely traded with Latin America, used a foot container that was easier to truck around winding mountain roads.Establishing a US standard and then getting it adopted internationally took more than a decade. Indeed, not only did the US Maritime Administration have to mediate in these rivalries but also to fight its own turf battles with the American Standards Association, an agency set up by the private sector. The matter was settled by using the power of federal money: the Federal Maritime Board (FMB), which handed out to public subsidies for shipbuilding, decreed that only the 8 x 8-foot containers in the lengths of l0, 20, 30 or 40 feet would be eligible for handouts.Identify the correct statement:
 ....
MCQ-> Read the following passage carefully and answer the questions given at the end. The second issue I want to address is one that comes up frequently - that Indian banks should aim to become global. Most people who put forward this view have not thought through the costs and benefits analytically; they only see this as an aspiration consistent with India’s growing international profile. In its 1998 report, the Narasimham (II) Committee envisaged a three tier structure for the Indian banking sector: 3 or 4 large banks having an international presence on the top, 8-10 mid-sized banks, with a network of branches throughout the country and engaged in universal banking, in the middle, and local banks and regional rural banks operating in smaller regions forming the bottom layer. However, the Indian banking system has not consolidated in the manner envisioned by the Narasimham Committee. The current structure is that India has 81 scheduled commercial banks of which 26 are public sector banks, 21 are private sector banks and 34 are foreign banks. Even a quick review would reveal that there is no segmentation in the banking structure along the lines of Narasimham II.A natural sequel to this issue of the envisaged structure of the Indian banking system is the Reserve Bank’s position on bank consolidation. Our view on bank consolidation is that the process should be market-driven, based on profitability considerations and brought about through a process of mergers & amalgamations (M&As;). The initiative for this has to come from the boards of the banks concerned which have to make a decision based on a judgment of the synergies involved in the business models and the compatibility of the business cultures. The Reserve Bank’s role in the reorganisation of the banking system will normally be only that of a facilitator.lt should be noted though that bank consolidation through mergers is not always a totally benign option. On the positive side are a higher exposure threshold, international acceptance and recognition, improved risk management and improvement in financials due to economies of scale and scope. This can be achieved both through organic and inorganic growth. On the negative side, experience shows that consolidation would fail if there are no synergies in the business models and there is no compatibility in the business cultures and technology platforms of the merging banks.Having given that broad brush position on bank consolidation let me address two specific questions: (i) can Indian banks aspire to global size?; and (ii) should Indian banks aspire to global size? On the first question, as per the current global league tables based on the size of assets, our largest bank, the State Bank of India (SBI), together with its subsidiaries, comes in at No.74 followed by ICICI Bank at No. I45 and Bank of Baroda at 188. It is, therefore, unlikely that any of our banks will jump into the top ten of the global league even after reasonable consolidation.Then comes the next question of whether Indian banks should become global. Opinion on this is divided. Those who argue that we must go global contend that the issue is not so much the size of our banks in global rankings but of Indian banks having a strong enough, global presence. The main argument is that the increasing global size and influence of Indian corporates warrant a corresponding increase in the global footprint of Indian banks. The opposing view is that Indian banks should look inwards rather than outwards, focus their efforts on financial deepening at home rather than aspiring to global size.It is possible to take a middle path and argue that looking outwards towards increased global presence and looking inwards towards deeper financial penetration are not mutually exclusive; it should be possible to aim for both. With the onset of the global financial crisis, there has definitely been a pause to the rapid expansion overseas of our banks. Nevertheless, notwithstanding the risks involved, it will be opportune for some of our larger banks to be looking out for opportunities for consolidation both organically and inorganically. They should look out more actively in regions which hold out a promise of attractive acquisitions.The surmise, therefore, is that Indian banks should increase their global footprint opportunistically even if they do not get to the top of the league table.Identify the correct statement from the following:
 ....
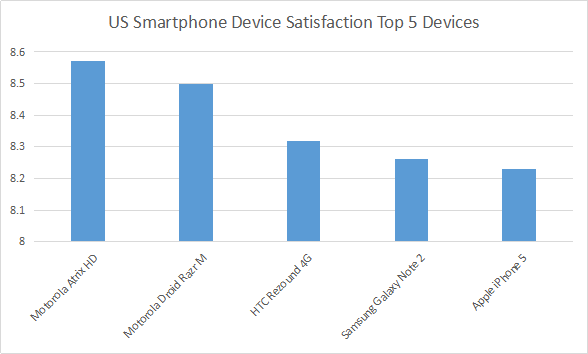
MCQ-> Please read the three reports (newspaper articles) on ranking of different players and products in smart phones industry and answer the questions that follow. Report 1: (Feb, 2013) Apple nabs crown as current top US mobile phone vendor Apple’s reign may not be long, as Samsung is poised to overtake Apple in April, 2013. For the first time since Apple entered the mobile phone market in 2007, it has been ranked the top mobile phone vendor in the US. For the latter quarter of 2012, sales of its iPhone accounted for 34 percent of all mobile phone sales in the US - including feature phones - according to the latest data from Strategy Analytics. While the iPhone has consistently been ranked the top smartphone sold in the US, market research firm NPD noted that feature phone sales have fallen off a cliff recently, to the point where 8 out of every 10 mobile phones sold in the US are now smartphones. That ratio is up considerably from the end of 2011, when smartphones had just cracked the 50 percent mark. Given this fact it’s no surprise that Apple, which only sells smartphones, has been able to reach the top of the overall mobile phone market domestically. For the fourth quarter of 2012, Apple ranked number one with 34 percent of the US mobile market, up from 25.6 percent year over year. Samsung grew similarly, up to 32.3 percent from 26.9 percent - but not enough to keep from slipping to second place. LG dropped to 9 percent from 13.7 percent, holding its third place spot. It should be noted that Samsung and LG both sell a variety of feature phones in addition to smartphones. Looking only at smartphones, the ranking is a little different according to NPD. Apple holds the top spot with 39 percent of the US smartphone market, while Samsung again sits at number two with 30 percent. Motorola manages to rank third with 7 percent, while HTC dropped to fourth with 6 percent. In the US smartphone market, LG is fifth with 6 percent. Note how the percentages aren’t all that different from overall mobile phone market share - for all intents and purposes, the smartphone market is the mobile phone market in the US going forward. Still, Samsung was the top mobile phone vendor overall for 2012, and Strategy Analytics expects Samsung to be back on top soon. “Samsung had been the number one mobile phone vendor in the US since 2008, and it will surely be keen to recapture that title in 2013 by launching improved new models such as the rumored Galaxy S4”. And while Apple is the top vendor overall among smartphones, its iOS platform is still second to the Android platform overall. Samsung is the largest vendor selling Android-based smartphones, but Motorola, HTC, LG, and others also sell Android devices, giving the platform a clear advantage over iOS both domestically and globally. Report 2: Reader’s Response (2013, Feb) I don’t actually believe the numbers for Samsung. Ever since the debacle in early 2011, when Lenovo called into question the numbers Samsung was touting for tablet shipments, stating that Samsung had only sold 20,000 of the 1.5 million tablets they shipped into the US the last quarter of 2010, Samsung (who had no response to Lenovo) has refused to supply quarterly sales numbers for smartphones or tablets. That’s an indication that their sales aren’t what analysts are saying. We can look to several things to help understand why. In the lawsuit between Apple and Samsung here last year, both were required to supply real sales numbers for devices under contention. The phones listed turned out to have sales between one third and one half of what had been guessed by IDC and others. Tablet sales were even worse. Of the 1.5 million tablets supposedly shipped to the US during that time, only 38,000 were sold. Then we have the usage numbers. Samsung tablets have only a 1.5% usage rate, where the iPad has over 90%. Not as much a difference with the phones but it’s still overwhelmingly in favor of iPhone. The problem is that with Apple’s sales, we have actual numbers to go by. The companies who estimate can calibrate what they do after those numbers come out. But with Samsung and many others, they can’t ever calibrate their methods, as there are no confirming numbers released from the firms. A few quarters ago, as a result, we saw iSupply estimate Samsung’s smartphone sales for the quarter at 32 million, with estimates from others all over the place up to 50 million. Each time some other company reported a higher number for that same quarter, the press dutifully used that higher number as THE ONE. But none of them was the one. Without accurate self-reporting of actual sales to the end users, none of these market share charts are worth a damn! Report 3: Contradictory survey (Feb, 2013) iPhone5 Ranks Fifth In U.S. Customer Satisfaction Survey inShare. The iPhone5 ranks fifth in customer satisfaction according to the results of a recent survey from OnDevice Research, a mobile device research group. In the poll, they asked 320,000 smartphone and tablet users from six different countries, how satisfied they were with their devices. According to 93,825 people from the US, Motorola Atrix HD is the most satisfying and Motorola’s Droid Razr took second spot. HTC Corp (TPE : 2498)’s Rezound 4G and Samsung Galaxy Note 2 took third and fourth spots, while Apple’s iPhone5 landed in fifth spot. It appears that Apple may be lagging in consumer interest. OnDevice Research, Sarah Quinn explained, “Although Apple created one of the most revolutionary devices of the past decade, other manufactures have caught up, with some Android powered devices now commanding higher levels of user satisfaction.” Despite the lower rankings, things aren’t looking too bad for Apple Inc. (NASDAQ:AAPL) elsewhere. In the United Kingdom, they ranked second place, right after HTC One X. Interesting enough, Apple did take top spot for overall satisfaction of mobile device, whereas Google Inc. (NASDAQ:GOOG) ranked second. Motorola Mobility Holdings Inc. (NYSE:NOK) took third, fourth, and fifth places respectively, while Sony Ericsson trailed behind at sixth place. The survey sampled mobile device users in the following countries: United States, United Kingdom, France, Germany, Japan, and Indonesia. Although OnDevice didn’t share the full list of devices mentioned in the survey, it does show some insight to what customers want. Unfortunately, there were still many questions regarding the survey that were left unanswered. Everyone wants to know why Google Inc. (NASDAQ:GOOG) was on the list when they are not an actual smartphone maker and why was Samsung Electronics Co., Ltd. (LON:BC94) on the bottom of the satisfaction list when the brand is leading elsewhere. Source: 92.825 US mobile users, July 2012 - January 2013 Fortunately, those questions were answered by OnDevice Research’s representative. He explained that the survey was conducted on mobile web where the survey software could detect the taker’s device and since user’s rate their satisfaction levels on a 1 to 10 scale, thanks to the Nexus device, Google was included.If you analyze the three reports above, which of the following statements would be the best inference?
 ....
Terms And Service:We do not guarantee the accuracy of available data ..We Provide Information On Public Data.. Please consult an expert before using this data for commercial or personal use
DMCA.com Protection Status Powered By:Omega Web Solutions
© 2002-2017 Omega Education PVT LTD...Privacy | Terms And Conditions