1.
Study the following table carefully to answer these question: For which of the following years the percentage increase/decrease in sales from the previous years was highest for State ‘E’?
Write Comment
Comments
- By: anil on 05 May 2019 01.32 amWe can observe from the table that E saw steep changes in 1999 and 2002. But since the original value was low in 1999, it the one that has the highest percentage change. Note that percentage change = $$frac{New .value - Original . value}{original.value} * 100$$ The value for 1999 = $$ frac{67-55}{55}*100$$ = 21.82%
Show Similar Question And Answers
 Table B
 Performance measures are as follows:
Half Yearly Sales Performance:$$\frac{\text{Oct 14 to Mar 15 Average Sales - April 14 to Sep 14 Average Sales}}{\text{April 14 to Sep 14 Average Sales}}$$Monthly Sales Performance:
$$\frac{\text{Current Month Sales - Pervious Month Sales}}{\text{Previous Month Sales}}$$Sales Volatility:
$$\frac{\text{Maximum Monthly Sales - Minimum Monthly Sales}}{\text{Average Monthly Sales}}$$What is the closest average number of 11⁄2 ton Window ACs sold by Torrent Enterprises during April 2014 - March 2015?
Performance measures are as follows:
Half Yearly Sales Performance:$$\frac{\text{Oct 14 to Mar 15 Average Sales - April 14 to Sep 14 Average Sales}}{\text{April 14 to Sep 14 Average Sales}}$$Monthly Sales Performance:
$$\frac{\text{Current Month Sales - Pervious Month Sales}}{\text{Previous Month Sales}}$$Sales Volatility:
$$\frac{\text{Maximum Monthly Sales - Minimum Monthly Sales}}{\text{Average Monthly Sales}}$$What is the closest average number of 11⁄2 ton Window ACs sold by Torrent Enterprises during April 2014 - March 2015?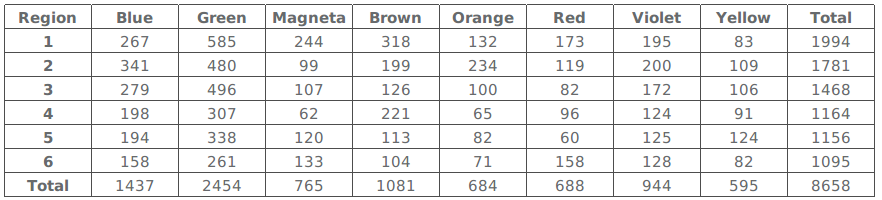 Table 2
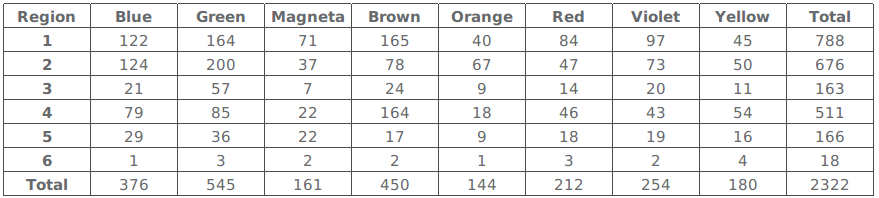 Table 3
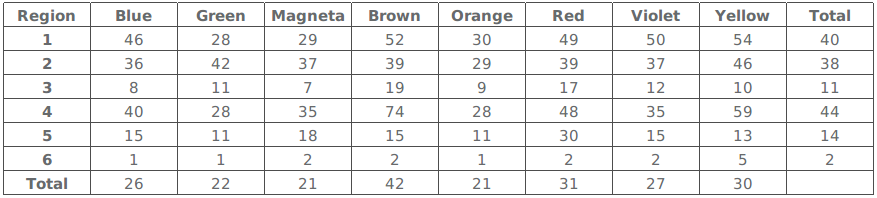 Table 4
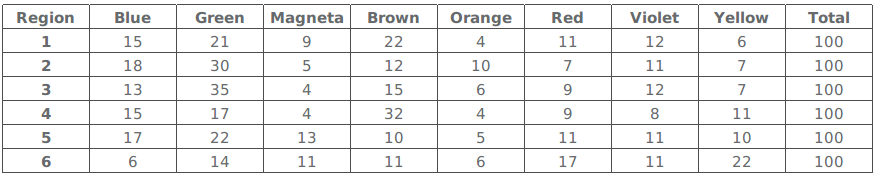 Table 5
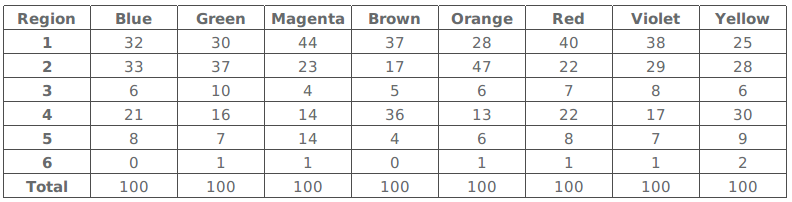 Which region-colour combination accounts for the highest percentage of sales to stock?