Toggle navigation
Home
Article Category
Question Papers
General Knowlege
Popular Pages
Multiple Choice Question in 049
Multiple Choice Question in
Multiple Choice Question in TRADES-INSTRUCTOR---GR-II---SMITHY---TECHNICAL-EDUCATION
Multiple Choice Question in -current-affairs-2016
Question Answer in ASSISTANT-PROFESSOR---COMPUTER-SCIENCE-AND-ENGINEERING---TECHNICAL-EDUCATION
Multiple Choice Question in ASSISTANT-PROFESSOR---COMPUTER-SCIENCE-AND-ENGINEERING---TECHNICAL-EDUCATION
Multiple Choice Question in english
Multiple Choice Question in abbreviations-abbreviations-m
Multiple Choice Question in SSC CHSL 7 March 2018 Morning Shift
Multiple Choice Question in 072/2016
Multiple Choice Question in 2016
Question Answer Bank
Multiple Choice Question Bank
Question Answer Category
Multiple Choice Question Category
Home
->
Multiple Choice Questions
1. Which of the following is the. largest single source of the Governments' earning from tax revenue?
(A): excise
(B): customs
(C): corporation tax
(D): income-tax
Previous Question
Show Answer
Next Question
Add Tags
Report Error
Show Marks
Write Comment
Type in
(Press Ctrl+g to toggle between English and the chosen language)
Post reply
Comments
Tags
Show Similar Question And Answers
QA->The GSTcouncil in November 2016 approved four tier tax structure under the Goods andServices Tax (GST). What is that four tier tax structure?....
QA->By whom is Agricultural Income Tax assigned to the State Governments?....
QA->Among source of power India has largest reserves of which source of power?....
QA->What is the principal source of revenue to the State Government in India?....
QA->What is the main source of revenue to meet different expenditures?....
MCQ-> Read the following passage carefully and answer the questions given below it. Certain words/phrases have been printed in bold to help you locate them while answering some of the questions. The past quarter of a century has seen several bursts of selling by the world’s governments, mostly but not always in benign market conditions. Those in the OECD, a rich-country club, divested plenty of stuff in the 20 years before the global financial crisis. The first privatisation wave, which built up from the mid-1980s and peaked in 2000, was largely European. The drive to cut state intervention under Margaret Thatcher in Britain soon spread to the continent. The movement gathered pace after 1991, when eastern Europe put thousands of rusting state-owned enterprises (SOEs) on the block. A second wave came in the mid-2000s, as European economies sought to cash in on buoyant markets. But activity in OECD countries slowed sharply as the financial crisis began. In fact, it reversed. Bailouts of failing banks and companies have contributed to a dramatic increase in government purchases of corporate equity during the past five years. A more lasting fea ture is the expansion of the state capitalism practised by China and other emerging economic powers. Governments have actually bought more equity than they have sold in most years since 2007, though sales far exceeded purchases in 2013. Today privatisation is once again “alive and well”, says William Megginson of the Michael Price College of Business at the University of Oklahoma. According to a global tally he recently completed, 2012 was the third-best year ever, and preliminary evidence suggests that 2013 may have been better. However, the geography of sell-offs has changed, with emerging markets now to the fore. China, for instance, has been selling minority stakes in banking, energy, engineering and broadcasting; Brazil is selling airports to help finance a $20 billion investment programme. Eleven of the 20 largest IPOs between 2005 and 2013 were sales of minority stakes by SOEs, mostly in developing countries. By contrast, state-owned assets are now “the forgotten side of the balance-sheet” in many advanced economies, says Dag Detter, managing partner of Whetstone Solutions, an adviser to governments on asset restructuring. They shouldn’t be. Governments of OECD countries still oversee vast piles of assets, from banks and utilities to buildings, land and the riches beneath (see table). Selling some of these holdings could work wonders: reduce debt, finance infrastructure, boost economic efficiency. But governments often barely grasp the value locked up in them. The picture is clearest for companies or company-like entities held by central governments. According to data compiled by the OECD and published on its website, its 34 member countries had 2,111 fully or majority-owned SOEs, with 5.9m employees, at the end of 2012. Their combined value (allowing for some but not all pension-fund liabilities) is estimated at $2.2 trillion, roughly the same size as the global hedge-fund industry. Most are in network industries such as telecoms, electricity and transport. In addition, many countries have large minority stakes in listed firms. Those in which they hold a stake of between 10% and 50% have a combined market value of $890 billion and employ 2.9m people. The data are far from perfect. The quality of reporting varies widely, as do definitions of what counts as a state-owned company: most include only centralgovernment holdings. If all assets held at sub-national level, such as local water companies, were included, the total value could be more than $4 trillion. Reckons Hans Christiansen, an OECD economist. Moreover, his team has had to extrapolate because some QECD members, including America and Japan, provide patchy data. America is apparently so queasy about discussions of public ownership of -commercial assets that the Treasury takes no part in the OECD’s working group on the issue, even though it has vast holdings, from Amtrak and the 520,000-employee Postal Service to power generators and airports. The club’s efforts to calculate the value that SOEs add to, or subtract from, economies were abandoned after several countries, including America, refused to co-operate. Privatisation has begun picking up again recently in the OECD for a variety of reasons. Britain’s Conservative-led coalition is fbcused on (some would say obsessed with) reducing the public debt-to-GDP ratio. Having recently sold the Royal Mail through a public offering, it is hoping to offload other assets, including its stake in URENCO, a uranium enricher, and its student-loan portfolio. From January 8th, under a new Treasury scheme, members of the public and businesses will be allowed to buy government land and buildings on the open market. A website will shortly be set up to help potential buyers see which bits of the government’s /..337 billion-worth of holdings ($527 billion at today’s rate, accounting for 40% of developable sites round Britain) might be surplus. The government, said the chief treasury secretary, Danny Alexander, “should not act as some kind of compulsive hoarder”. Japan has different reasons to revive sell-offs, such as to finance reconstruction after its devastating earthquake and tsunami in 2011. Eyes are once again turning to Japan Post, a giant postal-to-financial-services conglomerate whose oftpostponed partial sale could at last happen in 2015 and raise (Yen) 4 trillion ($40 billion) or more. Australia wants to sell financial, postal and aviation assets to offset the fall in revenues caused by the commodities slowdown. In almost all the countries of Europe, privatisation is likely “to surprise on the upside” as long as markets continue to mend, reckons Mr Megginson. Mr Christiansen expects to see three main areas of activity in coming years. First will be the resumption of partial sell-offs in industries such as telecoms, transport and utilities. Many residual stakes in partly privatised firms could be sold down further. France, for instance, still has hefty stakes in GDF SUEZ, Renault, Thales and Orange. The government of Francois Hollande may be ideologically opposed to privatisation, but it is hoping to reduce industrial stakes to raise funds for livelier sectors, such as broadband and health. The second area of growth should be in eastern Europe, where hundreds of large firms, including manufacturers, remain in state hands. Poland will sell down its stakes in listed firms to make up for an expected reduction in EU structural funds. And the third area is the reprivatisation of financial institutions rescued during the crisis. This process is under way: the largest privatisation in 2012 was the $18 billion offering of America’s residual stake in AIG, an insurance company.Which of the following statements is not true in the context of the given passage ?
....
MCQ->Which of the following is the. largest single source of the Governments' earning from tax revenue?....
MCQ->As we all know Govt. of Indiacollects tax revenue on variousactivities in the country. Whichof the following is a part of thetax revenue of the Govt. ? (i) Tax on Income(ii) Tax on Expenditure(iii) Tax on Property or CapitalAsset(iv) Tax on Goods and Services....
MCQ-> Study the followin information carefully and answer the questions.Four houses Blue, Green, Red and Yellow are located in a row in the given order. Each of the houses is occupied by a person earning a fixed amount of a salary. The four persons are Paul, Krishna, Laxman, and Som.Read the following instruction carefully: I. Paul lives between Som and Krishna II. Laxman does not stay in Blue house III. The person living in Red house earns more than that of person living in Blue IV. Salary of Som is more than that of Paul but lesser than that of Krishna V. One of the person earns Rs. 80, 000 VI. The person earning Rs. 110,000 is not Laxman VII. The salary difference between Laxman and Son is Rs. 30,000 VIII. The House in which Krishna lives is located between houses with persons earning salaries of Rs. 30,000 and Rs. 50,000 IX. Krishna does not live in Yellow house, and the person living in yellow house is not earning lowest salary among the four persons.Who lives in Red house?
....
MCQ-> Directions for the next three questions:Answer the following questions based on the information given below: Telecom operators get revenue from transfer of data and voice. Average revenue received from transfer of each unit of data is known as ARDT. In the diagram below, the revenue received form data transfer as percentage of total revenue received and the ARDT in US Dollars (USD) are given for various countries.The X axis represents the ARDT values and the Y axis represents the % of revenue from data transfer as a percentage of the total revenue.
It was found that the volume of data transfer in India is the same as that of Singapore. Then which of the following statements is true?
....
×
×
Type The Issue
×
Your Marks
Terms And Service:We do not guarantee the accuracy of available data ..We Provide Information On Public Data.. Please consult an expert before using this data for commercial or personal use
Powered By:Omega Web Solutions
© 2002-2017 Omega Education PVT LTD...
Privacy
|
Terms And Conditions
 Powered By:Omega Web Solutions
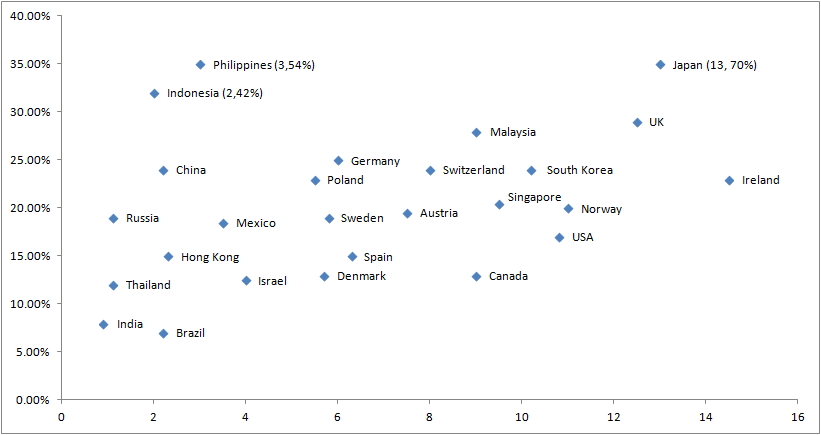 It was found that the volume of data transfer in India is the same as that of Singapore. Then which of the following statements is true?