Toggle navigation
Home
Article Category
Question Papers
General Knowlege
Popular Pages
Multiple Choice Question in 049
Multiple Choice Question in
Multiple Choice Question in 2016
Multiple Choice Question in TRADES-INSTRUCTOR---GR-II---SMITHY---TECHNICAL-EDUCATION
Multiple Choice Question in -current-affairs-2016
Question Answer in ASSISTANT-PROFESSOR---COMPUTER-SCIENCE-AND-ENGINEERING---TECHNICAL-EDUCATION
Multiple Choice Question in ASSISTANT-PROFESSOR---COMPUTER-SCIENCE-AND-ENGINEERING---TECHNICAL-EDUCATION
Multiple Choice Question in english
Multiple Choice Question in abbreviations-abbreviations-m
Multiple Choice Question in SSC CHSL 7 March 2018 Morning Shift
Multiple Choice Question in 072/2016
Question Answer Bank
Multiple Choice Question Bank
Question Answer Category
Multiple Choice Question Category
Home
->
Question Answer Bank
1. Who has become only the 11th batsman and the second Sri Lankan to score 10000 Test runs?
Answer: Kumar Sangakkara.
Previous Question
Next Question
Add Tags
Report Error
Reply
Type in
(Press Ctrl+g to toggle between English and the chosen language)
Post reply
Comments
Tags
Show Similar Question And Answers
QA->Who has become only the 11th batsman and the second Sri Lankan to score 10000 Test runs?....
QA->Sri Lankan batsman who became the 15th player in ODI history and the fifth from his nation to go past 9000 runs in the limited overs game?....
QA->Who has become the fastest wicketkeeper-batsman to score 3,000 runs in ODIs?....
QA->Who is the first Indian Batsman to cross 10000 runs in Tests?....
QA->Who is the first Indian Batsman to cross 10000 runs in Tests ?....
MCQ-> Study the given information carefully to answer the given questions. Seven athletes — M, N, 0, P, Q, R and S live on seven different floors of a building but not necessarily in the same order. The lowermost floor of the building is numbered one, the one above that is numbered two and so on till the topmost floor is numbered seven. Each one of them runs for a different distance in marathon 850 m, on till the topmost floor is numbered seven. Each one of them runs for a different distance in marathon 850 m, 1300 m, 2200 m, 2800 m, 3300 m, 4000 m and 4700 m, but not necessarily in the same order. The one who runs for 2200 m lives on floor numbered 3. Only one person lives between 0 and the one who runs for 2200 m. The one who runs for 4000 m lives immediately above O. Only one person lives between the one who runs for 4000 m and the one who runs for 1300 m. The number of people living between O and the one who runs for 1300 m is same as that between the one who runs for 4000 m and R. N lives on an odd numbered floor. N ran for 2000 m more than the one who lives on floor number 4. Only two people live between Q and the one who runs for 3300 m. The one who runs for 2800 m lives on one of the floors below Q but not on the floor number 2, Only two people live between M and S. The one who runs for 850 m lives immediately below M.How many people live between S and N?
...
MCQ->Mr. X runs a marathon starting from the point A he runs 5 km towards north and reach point B, then turns right runs 6 km reach point C, then turn light runs 8 km and reach point D, then turns right runs 10 km and reach point E, then turns right runs 6 km and reach point F, then turns right runs 1 km and reach point G, then turn rights runs 3 km and reach point H. The shortest distance between point D and G is?...
MCQ->A, B, C and D are four students in a class. A's total score is 20% less than B's total score, C's total score is 25% more than A's total score, D's total score is 20% more than A's total score. If the least total score among the scores is 240, then the ratio of the scores of the four students in the decreasing order is...
MCQ-> Read the following passage carefully and answer the questions given below it. Certain words/phrases have been printed in bold tohelp you locate them while answering some of the questions. During the last few years, a lot of hype has been heaped on the BRICS (Brazil, Russia, India, China, and South Africa). With their large populations and rapid growth, these countries, so the argument goes, will soon become some of the largest economies in the world and, in the case of China, the largest of all by as early as 2020. But the BRICS, as well as many other emerging-market economieshave recently experienced a sharp economic slowdown. So, is the honeymoon over? Brazil’s GDP grew by only 1% last year, and may not grow by more than 2% this year, with its potential growth barely above 3%. Russia’s economy may grow by barely 2% this year, with potential growth also at around 3%, despite oil prices being around $100 a barrel. India had a couple of years of strong growth recently (11.2% in 2010 and 7.7% in 2011) but slowed to 4% in 2012. China’s economy grew by 10% a year for the last three decades, but slowed to 7.8% last year and risks a hard landing. And South Africa grew by only 2.5% last year and may not grow faster than 2% this year. Many other previously fast-growing emerging-market economies – for example, Turkey, Argentina, Poland, Hungary, and many in Central and Eastern Europe are experiencing a similar slowdown. So, what is ailing the BRICS and other emerging markets? First, most emerging-market economies were overheating in 2010-2011, with growth above potential and inflation rising and exceeding targets. Many of them thus tightened monetary policy in 2011, with consequences for growth in 2012 that have carried over into this year. Second, the idea that emerging-market economies could fully decouple from economic weakness in advanced economies was
farfetched
: recession in the eurozone, near-recession in the United Kingdom and Japan in 2011-2012, and slow economic growth in the United States were always likely to affect emerging market performance negatively – via trade, financial links, and investor confidence. For example, the ongoing euro zone downturn has hurt Turkey and emergingmarket economies in Central and Eastern Europe, owing to trade links. Third, most BRICS and a few other emerging markets have moved toward a variant of state capitalism. This implies a slowdown in reforms that increase the private sector’s productivity and economic share, together with a greater economic role for state-owned enterprises (and for state-owned banks in the allocation of credit and savings), as well as resource nationalism, trade protectionism, import substitution industrialization policies, and imposition of capital controls. This approach may have worked at earlier stages of development and when the global financial crisis caused private spending to fall; but it is now distorting economic activity and depressing potential growth. Indeed, China’s slowdown reflects an economic model that is, as former Premier Wen Jiabao put it, “unstable, unbalanced, uncoordinated, and unsustainable,” and that now is adversely affecting growth in emerging Asia and in commodity-exporting emerging markets from Asia to Latin America and Africa. The risk that China will experience a hard landing in the next two years may further hurt many emerging economies. Fourth, the commodity super-cycle that helped Brazil, Russia, South Africa, and many other commodity-exporting emerging markets may be over. Indeed, a boom would be difficult to sustain, given China’s slowdown, higher investment in energysaving technologies, less emphasis on capital-and resource-oriented growth models around the world, and the delayed increase in supply that high prices induced. The fifth, and most recent, factor is the US Federal Reserve’s signals that it might end its policy of quantitative easing earlier than expected, and its hints of an even tual exit from zero interest rates. both of which have caused turbulence in emerging economies’ financial markets. Even before the Fed’s signals, emergingmarket equities and commodities had underperformed this year, owing to China’s slowdown. Since then, emerging-market currencies and fixed-income securities (government and corporate bonds) have taken a hit. The era of cheap or zerointerest money that led to a wall of liquidity chasing high yields and assets equities, bonds, currencies, and commodities – in emerging markets is drawing to a close. Finally, while many emerging-market economies tend to run current-account surpluses, a growing number of them – including Turkey, South Africa, Brazil, and India – are running deficits. And these deficits are now being financed in riskier ways: more debt than equity; more short-term debt than longterm debt; more foreign-currency debt than local-currency debt; and more financing from fickle cross-border interbank flows. These countries share other weaknesses as well: excessive fiscal deficits, abovetarget inflation, and stability risk (reflected not only in the recent political turmoil in Brazil and Turkey, but also in South Africa’s labour strife and India’s political and electoral uncertainties). The need to finance the external deficit and to avoid excessive depreciation (and even higher inflation) calls for raising policy rates or keeping them on hold at high levels. But monetary tightening would weaken already-slow growth. Thus, emerging economies with large twin deficits and other macroeconomic fragilities may experience further downward pressure on their financial markets and growth rates. These factors explain why growth in most BRICS and many other emerging markets has slowed sharply. Some factors are cyclical, but others – state capitalism, the risk of a hard landing in China, the end of the commodity supercycle -are more structural. Thus, many emerging markets’ growth rates in the next decade may be lower than in the last – as may the outsize returns that investors realised from these economies’ financial assets (currencies, equities. bonds, and commodities). Of course, some of the better-managed emerging-market economies will continue to experitnce rapid growth and asset outperformance. But many of the BRICS, along with some other emerging economies, may hit a thick wall, with growth and financial markets taking a serious beating.Which of the following statement(s) is/are true as per the given information in the passage ? A. Brazil’s GDP grew by only 1% last year, and is expected to grow by approximately 2% this year. B. China’s economy grew by 10% a year for the last three decades but slowed to 7.8% last year. C. BRICS is a group of nations — Barzil, Russia, India China and South Africa....
MCQ-> Directions for the following four questions: Answer the questions on the basis of the information given below.
Coach John sat with the score cards of Indian players from the 3 games in a one-day cricket tournament where the same set of players played for India and all the major batsmen got out. John summarized the batting performance through three diagrams, one for each games. In each diagram, the three outer triangles communicate the number of runs scored by the three top scores from India, where K, R, S, V, and Y represent Kaif, Rahul, Saurav, Virender, and Yuvraj respectively. The middle triangle in each diagram denotes the percentage of total score that was scored by the top three Indian scorers in that game. No two players score the same number of runs in the same game. John also calculated two batting indices for each player based on his scores in the tournaments; the R-index of a batsman is the difference between his highest and lowest scores in the 3 games while the M-index is the middle number, if his scores are arranged in a non-increasing order.For how many Indian players is it possible to calculate the exact M-index?
...
×
×
Type The Issue
Terms And Service:We do not guarantee the accuracy of available data ..We Provide Information On Public Data.. Please consult an expert before using this data for commercial or personal use
Powered By:Omega Web Solutions
© 2002-2017 Omega Education PVT LTD...
Privacy
|
Terms And Conditions
 Powered By:Omega Web Solutions
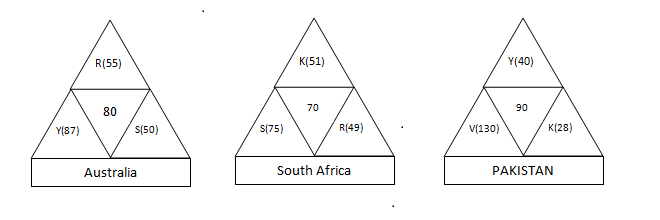 Coach John sat with the score cards of Indian players from the 3 games in a one-day cricket tournament where the same set of players played for India and all the major batsmen got out. John summarized the batting performance through three diagrams, one for each games. In each diagram, the three outer triangles communicate the number of runs scored by the three top scores from India, where K, R, S, V, and Y represent Kaif, Rahul, Saurav, Virender, and Yuvraj respectively. The middle triangle in each diagram denotes the percentage of total score that was scored by the top three Indian scorers in that game. No two players score the same number of runs in the same game. John also calculated two batting indices for each player based on his scores in the tournaments; the R-index of a batsman is the difference between his highest and lowest scores in the 3 games while the M-index is the middle number, if his scores are arranged in a non-increasing order.For how many Indian players is it possible to calculate the exact M-index?