Toggle navigation
Home
Article Category
Question Papers
General Knowlege
Popular Pages
Multiple Choice Question in 049
Multiple Choice Question in
Multiple Choice Question in 2016
Multiple Choice Question in -current-affairs-2016
Multiple Choice Question in TRADES-INSTRUCTOR---GR-II---SMITHY---TECHNICAL-EDUCATION
Question Answer in ASSISTANT-PROFESSOR---COMPUTER-SCIENCE-AND-ENGINEERING---TECHNICAL-EDUCATION
Multiple Choice Question in ASSISTANT-PROFESSOR---COMPUTER-SCIENCE-AND-ENGINEERING---TECHNICAL-EDUCATION
Multiple Choice Question in english
Multiple Choice Question in abbreviations-abbreviations-m
Multiple Choice Question in SSC CHSL 7 March 2018 Morning Shift
Multiple Choice Question in 072/2016
Question Answer Bank
Multiple Choice Question Bank
Question Answer Category
Multiple Choice Question Category
Home
->
Multiple Choice Questions
1. The table created by lexical analysis to describe all literals used in the source program, is:
(A): Terminal table
(B): Literal table
(C): Identifier table
(D): Reductions
Previous Question
Show Answer
Next Question
Add Tags
Report Error
Show Marks
Write Comment
Type in
(Press Ctrl+g to toggle between English and the chosen language)
Post reply
Comments
Tags
Show Similar Question And Answers
QA->What is the word used to describe the shape of earth?....
QA->What is social welfare program "Integrated Rural Development Program (IRDP) -1978" intented for ?....
QA->Name the translatory program which translates the high level language into machine language before running the program?....
QA->Who was the first to describe the mutiny of 1857 as the first war of independence?....
QA->Name the Swedish chemist, who was the first to describe the Global warming & Greenhouse effect in 1896?....
MCQ->The table created by lexical analysis to describe all literals used in the source program, is:....
MCQ->The table created by lexical analysis to describe all literals used in the source program, is....
MCQ->The Object Model supports different literal types, but does not support atomic literals, collection literals, and structured literals.....
MCQ->There are 240 second year students in a B - School. The Finance area offers 3 electives in the second year. These are Financial Derivatives, Behavioural Finance, and Security Analysis. Four students have taken all the three electives, and 48 students have taken Financial Derivatives. There are twice as many students who study Financial Derivatives and Security Analysis but not Behavioural Finance, as those who study both Financial Derivatives and Behavioural Finance but not Security Analysis, and 4 times as many who study all the three. 124 students study Security Analysis. There are 59 students who could not muster courage to take up any of these subjects. The group of students who study both Financial Derivatives and Security Analysis but not Behavioural Finance, is exactly the same as the group made up of students who study both Behavioural Finance and Security Analysis. How many students study Behavioural Finance only?....
MCQ-> The first table gives the number of saris (of all the eight colours) stocked in six regional showrooms. The second gives the number of saris (of all the eight colours) sold in these six regional showrooms. The third table gives the percentage of saris sold to saris stocked for each colour in each region. The fourth table gives the percentage of saris of a specific colour sold within that region. The fifth table gives the percentage of saris of a specific colour sold across all the regions. Study the tables and for each of the following questions, choose the best alternative.Table 1
Table 2
Table 3
Table 4
Table 5
Which region-colour combination accounts for the highest percentage of sales to stock?
....
×
×
Type The Issue
×
Your Marks
Terms And Service:We do not guarantee the accuracy of available data ..We Provide Information On Public Data.. Please consult an expert before using this data for commercial or personal use
Powered By:Omega Web Solutions
© 2002-2017 Omega Education PVT LTD...
Privacy
|
Terms And Conditions
 Powered By:Omega Web Solutions
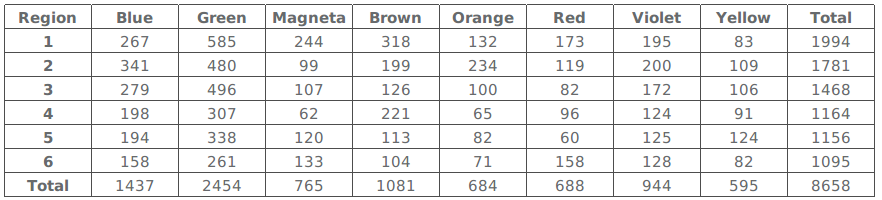 Table 2
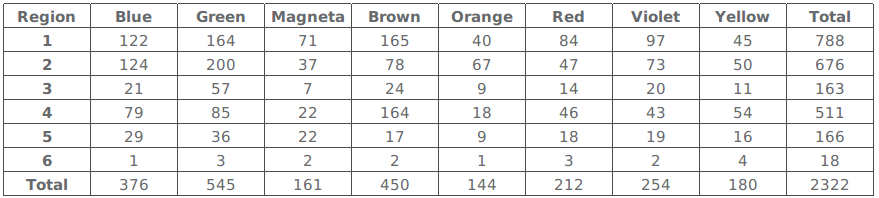 Table 3
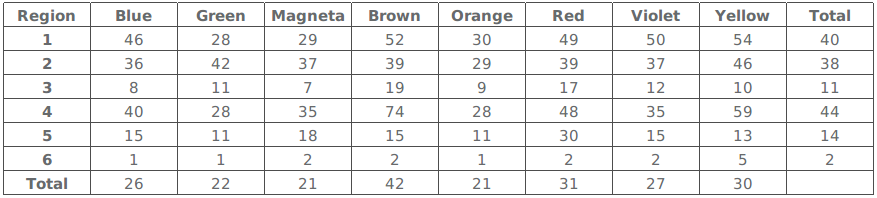 Table 4
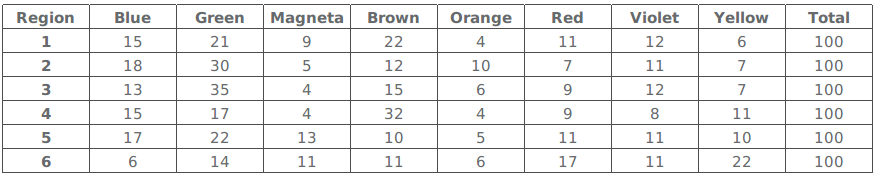 Table 5
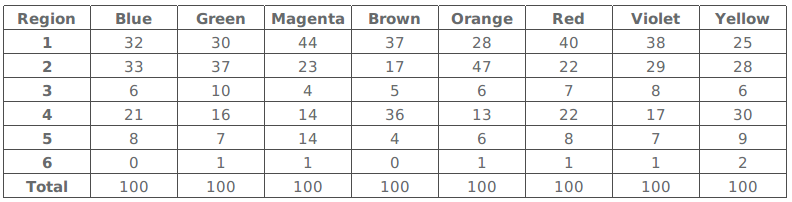 Which region-colour combination accounts for the highest percentage of sales to stock?