Toggle navigation
Home
Article Category
Question Papers
General Knowlege
Popular Pages
Multiple Choice Question in 049
Multiple Choice Question in
Multiple Choice Question in 2016
Multiple Choice Question in TRADES-INSTRUCTOR---GR-II---SMITHY---TECHNICAL-EDUCATION
Multiple Choice Question in -current-affairs-2016
Question Answer in ASSISTANT-PROFESSOR---COMPUTER-SCIENCE-AND-ENGINEERING---TECHNICAL-EDUCATION
Multiple Choice Question in ASSISTANT-PROFESSOR---COMPUTER-SCIENCE-AND-ENGINEERING---TECHNICAL-EDUCATION
Multiple Choice Question in english
Multiple Choice Question in abbreviations-abbreviations-m
Multiple Choice Question in SSC CHSL 7 March 2018 Morning Shift
Multiple Choice Question in 072/2016
Question Answer Bank
Multiple Choice Question Bank
Question Answer Category
Multiple Choice Question Category
Home
->
Multiple Choice Questions
1. Find the ratio of shaded area to unshaded area
(A): $$\frac{1}{5}(\sqrt{21}-2)$$
(B): $$\frac{1}{5}(3\sqrt{7}-2)$$
(C): $$\frac{1}{5}(3\sqrt{7}-2\sqrt{3})$$
(D): None of these
Previous Question
Show Answer
Next Question
Add Tags
Report Error
Show Marks
Write Comment
Type in
(Press Ctrl+g to toggle between English and the chosen language)
Post reply
Comments
Tags
IIFT 2009 Question Paper
Show Similar Question And Answers
QA->Highest useful compression ratio is the compression ratio at which the engine....
QA->The ratio of the age of two sisters is 3:The product of their ages is The ratio of their ages after 5 years will be:....
QA->What ratio of forest area needed for ecological balance in India?....
QA->What ratio of forest area needed for ecologycal balance in India?....
QA->The essential condition for the application of Simpson’s rule to find the area, the number ordinates should be :....
MCQ->Find the ratio of shaded area to unshaded area
....
MCQ->Let $$C$$ be a circle with centre $$P_0$$ and $$AB$$ be a diameter of $$C$$. Suppose $$P_1$$ is the mid point of the line segment $$P_0B$$,$$P_2$$ is the mid point of the line segment $$P_1B$$ and so on. Let $$C_1,C_2,C_3,...$$ be circles with diameters $$P_0P_1, P_1P_2, P_2P_3...$$ respectively. Suppose the circles $$C_1, C_2, C_3,...$$ are all shaded. The ratio of the area of the unshaded portion of $$C$$ to that of the original circle is....
MCQ->Three equal circles are drawn on a triangle ABC, with points A, B and C as the centres. Radius of each of the circle is equal to half of the side of the triangle ABC. (Figure not to the scale)
Area of shaded region 1 = $$128\frac{1}{3}cm^{2}$$
Quantity :
I. The area of the shaded region 2 ( in cm^{2} ) II. 30 cm^{2} ....
MCQ-> The table below gives the achievements of Agricultural Development Programmes from 1983 - 84 to 1988 - 89. Study the following table and for each of the following questions, choose the best alternative.
Irrigation (Cumulative in Million Hectares)
High yielding varieties (Million Hectares)
Consumption of chemical fertilizers
Gross Cropped area (Million hectares)
The consumption of chemical fertilizer per hectare of gross cropped area is lowest for the year
....
MCQ-> Study the following table to answer these questions:
Break up of expenditure under various plans (in Rs.Millions)
If one of the following graphs were to represent the spending on water supply and sanitation in various plans, which of the following graphs will suit the best?
....
×
×
Type The Issue
×
Your Marks
Terms And Service:We do not guarantee the accuracy of available data ..We Provide Information On Public Data.. Please consult an expert before using this data for commercial or personal use
Powered By:Omega Web Solutions
© 2002-2017 Omega Education PVT LTD...
Privacy
|
Terms And Conditions

 Powered By:Omega Web Solutions
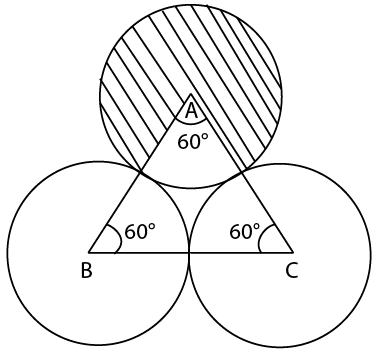 Area of shaded region 1 = $$128\frac{1}{3}cm^{2}$$
Quantity :
I. The area of the shaded region 2 ( in cm^{2} )
II. 30 cm^{2}
....
Area of shaded region 1 = $$128\frac{1}{3}cm^{2}$$
Quantity :
I. The area of the shaded region 2 ( in cm^{2} )
II. 30 cm^{2}
.... Irrigation (Cumulative in Million Hectares)
 High yielding varieties (Million Hectares)
 Consumption of chemical fertilizers
 Gross Cropped area (Million hectares)
 The consumption of chemical fertilizer per hectare of gross cropped area is lowest for the year
 If one of the following graphs were to represent the spending on water supply and sanitation in various plans, which of the following graphs will suit the best?


 ....
....