1.
Answer the questions based on the following graphs
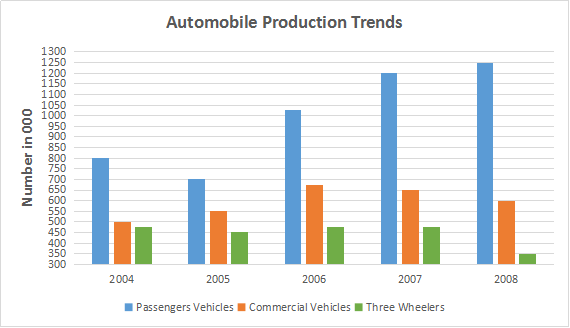
 Which of the following year exhibited highest percentage decrease over the preceding year in the automobile production?
Write Comment
Comments
- By: anil on 05 May 2019 02.40 am
Show Similar Question And Answers
 If the production of wheat by Madhya Pradesh in the years 2003, 2004, 2005 and 2007 increase by 30%, 40%, 45% and 40% respectively, what will be the overall percentage increase in the production of wheat in the state in the given years ?
 If one of the following graphs were to represent the spending on water supply and sanitation in various plans, which of the following graphs will suit the best?


 ....
....
Total automobile production in the year 2006 = 1025+675+475 = 2175
Total automobile production in the year 2007 = 1200+650+475 = 2325
Total automobile production in the year 2008 = 1250+600+350 = 2200
We can see that production decreased only twice during the given period in the year 2005 and 2008. Hence, the percentage decrease in the year 2005 over the year 2004 = $$dfrac{1775-1700}{1775} imes 100$$ = 4.225 percent. Similarly, the percentage decrease in the year 2008 over the year 2007 = $$dfrac{2325-2200}{2325} imes 100$$ = 5.376 percent. Therefore, we can say that option D is the correct answer.