1.
Analyse the following chart showing the exports and imports of Sono Ltd. and answer the questions based on this chart
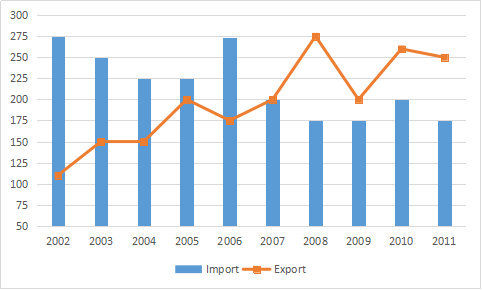 Approximately by what percentage are the total Exports greater/ smaller than the total imports for the given period?
Write Comment
Comments
- By: anil on 05 May 2019 02.39 am
Show Similar Question And Answers
 Exhibit 2: India's Total Merchandize Exports (US Dollar in Billion) and Percentage Exports of Food, Fuel, Manufacturers and Ores and Metals (2012 - 2016)
 What shall be approximate Manufactures exportS of India in ihe year 2016 based on average exports for the period 2012-2016?
 Further, it is known that:[list][*]In the state of MP, Truthful Ltd. has the highest market share.[*]Aggressive Ltd.’s aggregate revenue differs from Honest Ltd.’s by Rs. 5 million.[/list]What can be said regarding the following two statements?Statement 1: Profitable Ltd. has the lowest share in MP market.Statement 2: Honest Ltd.’s total revenue is more than Profitable Ltd.
 For which company, the average annual expenses were maximum in the given period?
Total Exports during the given period = $$112.5+150+150+275+200+175+200+200+262.5+250 = 1975$$
Thus, Total exports is smaller than Total imports by $$dfrac{2175-1975}{2175} approx 9\%$$
Hence, option C is the correct answer.