1.
Given below are the shares of sectoral FDI inflow to India in different years (figures in percentage). Answer the questions on the basis of following data.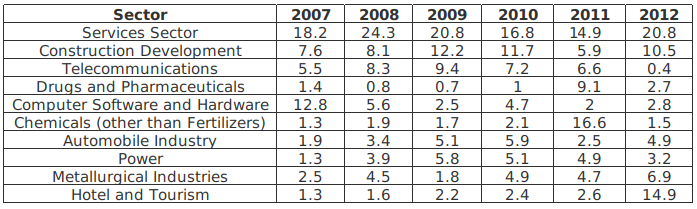 Among the four sectors mentioned below, the increase in share of FDI inflow between the terminal years 2007 and 2012 has been HIGHEST for
Write Comment
Comments
- By: anil on 05 May 2019 02.39 am
Show Similar Question And Answers
 Source: 92.825 US mobile users, July 2012 - January 2013
Fortunately, those questions were answered by OnDevice Research’s representative. He explained that the survey was conducted on mobile web where the survey software could detect the taker’s device and since user’s rate their satisfaction levels on a 1 to 10 scale, thanks to the Nexus device, Google was included.If you analyze the three reports above, which of the following statements would be the best inference?
Source: 92.825 US mobile users, July 2012 - January 2013
Fortunately, those questions were answered by OnDevice Research’s representative. He explained that the survey was conducted on mobile web where the survey software could detect the taker’s device and since user’s rate their satisfaction levels on a 1 to 10 scale, thanks to the Nexus device, Google was included.If you analyze the three reports above, which of the following statements would be the best inference?
A. Services Sector = 20.8 - 18.2 = 2.6
B. Construction Development = 10.5-7.6 = 2.9
C. Automobile industry = 4.9-1.9 = 3
D. Power = 3.2-1.3 = 1.9
Thus, the increase in share of FDI inflow between the terminal years 2007 and 2012 has been HIGHEST for the Automobile industry.
Hence, option C is the correct answer.