Toggle navigation
Home
Article Category
Question Papers
General Knowlege
Popular Pages
Multiple Choice Question in 049
Multiple Choice Question in
Multiple Choice Question in 2016
Multiple Choice Question in -current-affairs-2016
Multiple Choice Question in TRADES-INSTRUCTOR---GR-II---SMITHY---TECHNICAL-EDUCATION
Question Answer in ASSISTANT-PROFESSOR---COMPUTER-SCIENCE-AND-ENGINEERING---TECHNICAL-EDUCATION
Multiple Choice Question in ASSISTANT-PROFESSOR---COMPUTER-SCIENCE-AND-ENGINEERING---TECHNICAL-EDUCATION
Multiple Choice Question in english
Multiple Choice Question in abbreviations-abbreviations-m
Multiple Choice Question in SSC CHSL 7 March 2018 Morning Shift
Multiple Choice Question in 072/2016
Question Answer Bank
Multiple Choice Question Bank
Question Answer Category
Multiple Choice Question Category
Home
->
Multiple Choice Questions
1. Identify the state whose tax revenue increased exactly by the same amount in two successive pair of years?
(A): Karnataka
(B): West Bengal
(C): Uttar Pradesh
(D): Tamil Nadu
Previous Question
Show Answer
Next Question
Add Tags
Report Error
Show Marks
Write Comment
Type in
(Press Ctrl+g to toggle between English and the chosen language)
Post reply
Comments
Tags
CAT 2002
Show Similar Question And Answers
QA->MAXIMUM AMOUNT OF TOTAL REVENUE OF GOVERNMENT OF INDIA COMES FROM WHICH TAX....
QA->The GSTcouncil in November 2016 approved four tier tax structure under the Goods andServices Tax (GST). What is that four tier tax structure?....
QA->The amount of input tax that is permitted to be sent off against output tax ?....
QA->A gas which obeys the gas laws exactly is called _____ :....
QA->The difference between compound interest and simple interest for an amount in 2 years is Rs.If the rate of interest is 8%, the amount is :....
MCQ->Identify the state whose tax revenue increased exactly by the same amount in two successive pair of years?....
MCQ->As we all know Govt. of Indiacollects tax revenue on variousactivities in the country. Whichof the following is a part of thetax revenue of the Govt. ? (i) Tax on Income(ii) Tax on Expenditure(iii) Tax on Property or CapitalAsset(iv) Tax on Goods and Services....
MCQ-> Directions for the next three questions:Answer the following questions based on the information given below: Telecom operators get revenue from transfer of data and voice. Average revenue received from transfer of each unit of data is known as ARDT. In the diagram below, the revenue received form data transfer as percentage of total revenue received and the ARDT in US Dollars (USD) are given for various countries.The X axis represents the ARDT values and the Y axis represents the % of revenue from data transfer as a percentage of the total revenue.
It was found that the volume of data transfer in India is the same as that of Singapore. Then which of the following statements is true?
....
MCQ-> Read the following passage carefully and answer the questions based on it. Some words have been printed in bold to help you locate them while answering some of the questions.Notwithstanding the fact that the share of household savings to GDS is showing decline, still this segment is the significant contributor to GDS with 70% share. Indian households are among the most frugal in the world However,
commensurate
capital formation has not been taking place as a lion's share of household savings are being parked in physical assets compared to financial assets. The pattern of disposition of saving is an important factor in determining how the saved amount is utilized for productive purposes. The proportion of household saving in financial assets determines the channelisation of saving for investment in other sectors of the economy. However, the volume of investment of saving in physical assets determines the productivity and generation of income in that sector itself. Post-Independence era has witnessed a significant shift in deployment of household savings especially the share of financial assets increased from 26.39% in 1950 to 54.05% in 1990 may be on account of increased bank branch network across the country coupled with improved awareness of investors on various financial / banking products. However, contrast to common expectations, the share of financial assets in total household savings has come down from 54.05% to 50.21% especially in post reform period i.e. 1990 to 2010 despite providing easy access and availability of banking facilities compared to earlier years. The increased share of physical assets over financial assets (around 4%) during the last two decades is a cause of concern requires focused attention to arrest the trend. Traditionally, the Indians are risk-averse and prefer to invest surplus funds in physical assets such as Gold, Silver and lands. Nevertheless, considerable share of savings also owing to financial assets, which includes, Currency, Bank Deposits, Claims on Government,
Contractual
Savings, Equities The composition of household financial savings shows that the bank deposits (44%) continue to remain the major contributor along with the rise in the Contractual Savings, Claims on Government and Currency. Though there was gradual decline in currency holdings by the households i.e. 13.79% in 1970s to 9.30% in 2007, still the present currency holding level with households appears to be on high side compared to other countries. The primary reasons for higher currency holdings could be absence of banking facilities in majority villages (5.70 lakh villages)as well as hoarding of unaccounted money in the form of cash to circumvent tax laws. Though, cash is treated as financial asset, in reality, a major portion of currency is blocked and become unproductive. Bank deposits seemed to be the preferred choice mainly on account of its inbuilt features such as Safety, Security and Liquidity. Traditionally, the Household sector has been playing a leading role in the landscape of bank deposits followed by the Government sector. However, the last two decades has witnessed significant shift in ownership of Bank deposits. While there was improvement in Corporate and Government sectors' share by 8.30% and 7.20% respectively during the period 1999 to 2009, household sector lost a share of 13.30% in the post reform period. In the post independence era, Indian financial system was characterized by poor infrastructure and low level of financial deepening. Savings in physical assets constituted the largest portion of the savings compared to the financial assets in the initial years of the planning periods. While rural households were keen on acquiring farm assets, the portfolio of urban households constituted consumer durables, gold, jewellery and house property.Despite the fact that the household savings have been gradually moving from physical assets to financial assets over the years, still 49.79% of household savings are wrapped in unproductive physical assets, which is a cause of concern as the share of physical assets to total savings are very high in the recent years compared to emerging economies. This trend needs to be arrested as scarce funds are being diverted into unproductive segments. Of course, investment in Real estate sector can be treated as productive provided construction activity is commenced within reasonable time, but it is regrettably note that many investors just buy and hold it for speculation leading to unproductive investments. India has probably the largest fascination with gold than any other country in the world with a share of 9.50% of the world's total gold holdings. The World Gold Council believes that they are over 18000 tonnes of gold holding in the country. More impressive is the fact that current demand from India alone consumes 25% of the world's annual gold output. Large amount of capital is blocked in gold which resides in bank lockers and remain unproductive. Indian economy would grow faster if the capital markets could attract more of the nation's savings and channel them into more productive areas, especially infrastructure. If the Indian market can develop and evolve into a more mature financial system, which persuades the middle class to put more of its money into equities, the potential is
mind-boggling.
Which of the following statement (s) is/are correct in the context of the given passage? I. The GDS percentage to GDP has shown considerable improvement from 10% in 1950 to 33.7% in 2010, which is one of the highest globally. II. The saving rate however shows an increasing trend, marginal decline is observed under tic use hold sector. III. The share of financial assets in total household savings have come down from 54.05% to 21% especially in post reform era.....
MCQ-> Based on the following information
Total income tax payable is obtained by adding two additional surcharges on calculated income tax.Education Cess : An additional surcharge called ‘Education Cess’ is levied at the rate of 2% on the amount of income tax.Secondary and Higher Education Cess : An additional surcharge called ‘Secondary and Higher Education Cess` is levied at the rate of 1% on the amount of income tax.Sangeeta is a young working lady. Towards the end of the financial year 2009 - 10, she found her total annual income to be Rs. 3, 37, 425/ -. What % of her income is payable as income tax?
....
×
×
Type The Issue
×
Your Marks
Terms And Service:We do not guarantee the accuracy of available data ..We Provide Information On Public Data.. Please consult an expert before using this data for commercial or personal use
Powered By:Omega Web Solutions
© 2002-2017 Omega Education PVT LTD...
Privacy
|
Terms And Conditions
 Powered By:Omega Web Solutions
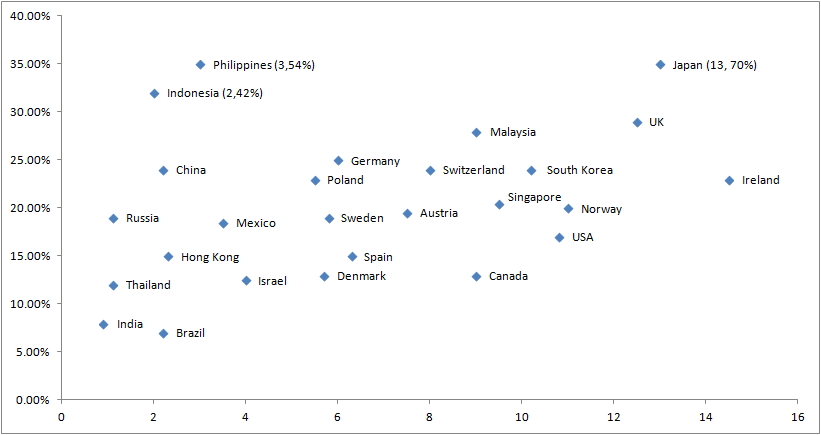 It was found that the volume of data transfer in India is the same as that of Singapore. Then which of the following statements is true?
 Total income tax payable is obtained by adding two additional surcharges on calculated income tax.Education Cess : An additional surcharge called ‘Education Cess’ is levied at the rate of 2% on the amount of income tax.Secondary and Higher Education Cess : An additional surcharge called ‘Secondary and Higher Education Cess` is levied at the rate of 1% on the amount of income tax.Sangeeta is a young working lady. Towards the end of the financial year 2009 - 10, she found her total annual income to be Rs. 3, 37, 425/ -. What % of her income is payable as income tax?