Toggle navigation
Home
Article Category
Question Papers
General Knowlege
Popular Pages
Multiple Choice Question in 049
Multiple Choice Question in
Multiple Choice Question in 2016
Multiple Choice Question in -current-affairs-2016
Multiple Choice Question in TRADES-INSTRUCTOR---GR-II---SMITHY---TECHNICAL-EDUCATION
Question Answer in ASSISTANT-PROFESSOR---COMPUTER-SCIENCE-AND-ENGINEERING---TECHNICAL-EDUCATION
Multiple Choice Question in ASSISTANT-PROFESSOR---COMPUTER-SCIENCE-AND-ENGINEERING---TECHNICAL-EDUCATION
Multiple Choice Question in english
Multiple Choice Question in abbreviations-abbreviations-m
Multiple Choice Question in SSC CHSL 7 March 2018 Morning Shift
Multiple Choice Question in 072/2016
Question Answer Bank
Multiple Choice Question Bank
Question Answer Category
Multiple Choice Question Category
Home
->
Multiple Choice Questions
1. If efficiency is defined as the ratio of revenue to expenses, which operation was the least efficient in 2000?
(A): Spain
(B): Argentina
(C): Far East
(D): None of these
Previous Question
Show Answer
Next Question
Add Tags
Report Error
Show Marks
Write Comment
Type in
(Press Ctrl+g to toggle between English and the chosen language)
Post reply
Comments
Tags
CAT 2002
Show Similar Question And Answers
QA->……….. is that segment of activity of a business which is responsible for both revenue and expenses.....
QA->Volumetric efficiency is the ratio of :....
QA->Refund of revenue is defined in:....
QA->Highest useful compression ratio is the compression ratio at which the engine....
QA->The ratio of the age of two sisters is 3:The product of their ages is The ratio of their ages after 5 years will be:....
MCQ-> Read the following passage carefully and answer the questions given. Certain words/phrases have been given in bold to help you locate them while answering some of the questions. From a technical and economic perspective, many assessments have highlighted the presence of cost-effective opportunities to reduce energy use in buildings. However several bodies note the significance of multiple barriers that prevent the take-up of energy efficiency measures in buildings. These include lack of awareness and concern, limited access to reliable information from trusted sources, fear about risk, disruption and other ‘transaction costs’ concerns about up-front costs and inadequate access to suitably priced finance, a lack of confidence in suppliers and technologies and the presence of split incentives between landlords and tenants. The widespread presence of these barriers led experts to predict thatwithout a
concerted
push from policy, two-thirds of the economically viable potential to improve energy efficiency will remain
unexploited
by 2035. These barriers are
albatross around the neck
that represent a classic market failure and a basis for governmental intervention. While these measurements focus on the technical, financial or economic barriers preventing the take-up of energy efficiency options in buildings, others emphasise the significance of the often deeply embedded social practices that shape energy use in buildings. These analyses focus not on the preferences and rationalities that might shape individual behaviours, but on the ‘entangled’ cultural practices, norms, values and routines that
underpin
domestic energy use. Focusing on the practice-related aspects of consumption generates very different conceptual framings and policy prescriptions than those that emerge from more traditional or mainstream perspectives. But the underlying case for government intervention to help to promote retrofit and the diffusion of more energy efficient particles is still apparent, even though the forms of intervention advocated are often very different to those that emerge from a more technical or economic perspective. Based on the recognition of the multiple barriers to change and the social, economic and environmental benefits that could be realised if they were overcome, government support for retrofit (renovating existing infrastructure to make it more energy efficient) has been widespread. Retrofit programmes have been supported and adopted in diverse forms in many setting and their ability to recruit householders and then to impact their energy use has been discussed quite extensively. Frequently, these discussions have criticised the extent to which retrofit schemes rely on incentives and the provision of new technologies to change behaviour whilst ignoring the many other factors that might limit either participation in the schemes or their impact on the behaviours and prac-tices that shape domestic energy use. These factors are obviously central to the success of retrofit schemes, but evaluations of different schemes have found that despite these they can still have significant impacts. Few experts that the best estimate of the gap between the technical potential and the actual in-situ performance of energy efficiency measures is 50%, with 35% coming from performance gaps and 15% coming from ‘comfort taking’ or direct rebound effects. They further suggest that the direct rebound effect of energy efficiency measures related to household heating is Ilkley to be less than 30% while rebound effects for various domestic energy efficiency measures vary from 5 to 15% and arise mostly from indirect effects (i.e., where savings from energy efficiency lead to increased demand for goods and services). Other analyses also note that the gap between technical potential and actual performance is likely to vary by measure, with the range extending from 0% for measures such as solar water heating to 50% for measures such as improved heating controls. And others note that levels of comfort taking are likely to vary according to the levels of consumption and fuel poverty in the sample of homes where insulation is installed, with the range extending from 30% when considering homes across all income groups to around 60% when considering only lower income homes. The scale of these gapsis significant because it materially affects the impacts of retrofit schemes and expectations and perceptions of these impacts go on to influence levels of political, financial and public support for these schemes. The literature on retrofit highlights the presence of multiple barriers to change and the need for government support, if these are to be overcome. Although much has been written on the extent to which different forms of support enable the wider take-up of domestic energy efficiency measures, behaviours and practices, various areas of contestation remain and there is still an absence of
robust
ex-post evidence on the extent to which these schemes actually do lead to the social, economic and environmental benefits that are widely claimed.Which of the following is most nearly the OPPOSITE in meaning to the word ‘CONCERTED’ as used in the passage ?
....
MCQ-> I suggest that the essential character of the Trade Cycle and, especially, the regularity of time-sequence and of duration which justifies us in calling it a cycle, is mainly due to the way in which the marginal efficiency of capital fluctuates. The Trade Cycle is best regarded, I think, as being occasioned by a cyclical change in the marginal efficiency of capital, though complicated and often aggravated by associated changes in the other significant short period variables of the economic system.By a cyclical movement we mean that as the system progresses in, e.g. the upward direction, the forces propelling it upwards at first gather force and have a cumulative effect on one another but gradually lose their strength until at a certain point they tend to be replaced by forces operating in the opposite direction; which in turn gather force for a time and accentuate one another, until they too, having reached their maximum development, wane and give place to their opposite. We do not, however, merely mean by a cyclical movement that upward and downward tendencies, once started, do not persist for ever in the same direction but are ultimately reversed. We mean also that there is some recognizable degree of regularity in the time-sequence and duration of the upward and downward movements. There is, however, another characteristic of what we call the Trade Cycle which our explanation must cover if it is to be adequate; namely, the phenomenon of the ‘crisis’ the fact that the substitution of a downward for an upward tendency often takes place suddenly and violently, whereas there is, as a rule, no such sharp turning-point when an upward is substituted for a downward tendency. Any fluctuation in investment not offset by a corresponding change in the propensity to consume will, of course, result in a fluctuation in employment. Since, therefore, the volume of investment is subject to highly complex influences, it is highly improbable that all fluctuations either in investment itself or in the marginal efficiency of capital will be of a cyclical character.We have seen above that the marginal efficiency of capital depends, not only on the existing abundance or scarcity of capital-goods and the current cost of production of capital- goods, but also on current expectations as to the future yield of capital-goods. In the case of durable assets it is, therefore, natural and reasonable that expectations of the future should play a dominant part in determining the scale on which new investment is deemed advisable. But, as we have seen, the basis for such expectations is very precarious. Being based on shifting and unreliable evidence, they are subject to sudden and violent changes. Now, we have been accustomed in explaining the ‘crisis’ to lay stress on the rising tendency of the rate of interest under the influence of the increased demand for money both for trade and speculative purposes. At times this factor may certainly play an aggravating and, occasionally perhaps, an initiating part. But I suggest that a more typical, and often the predominant, explanation of the crisis is, not primarily a rise in the rate of interest, but a sudden collapse in the marginal efficiency of capital. The later stages of the boom are characterized by optimistic expectations as to the future yield of capital goods sufficiently strong to offset their growing abundance and their rising costs of production and, probably, a rise in the rate of interest also. It is of the nature of organized investment markets, under the influence of purchasers largely ignorant of what they are buying and of speculators who are more concerned with forecasting the next shift of market sentiment than with a reasonable estimate of the future yield of capital-assets, that, when disillusion falls upon an over-optimistic and over- bought market, it should fall with sudden and even catastrophic force. Moreover, the dismay and uncertainty as to the future which accompanies a collapse in the marginal efficiency of capital naturally precipitates a sharp increase in liquidity-preference and hence a rise in the rate of interest. Thus the fact that a collapse in the marginal efficiency of capital tends to be associated with a rise in the rate of interest may seriously aggravate the decline in investment. But the essence of the situation is to be found, nevertheless, in the collapse in the marginal efficiency of capital, particularly in the case of those types of capital which have been contributing most to the previous phase of heavy new investment. Liquidity preference, except those manifestations of it which are associated with increasing trade and speculation, does not increase until after the collapse in the marginal efficiency of capital. It is this, indeed, which renders the slump so intractable. Which of the following does not describe the features of cyclical movement?
....
MCQ->If efficiency is defined as the ratio of revenue to expenses, which operation was the least efficient in 2000?....
MCQ-> Study the following information carefully and answer the question given below: Following are the conditions for selecting Senior Manager General Banking in a bank: (i) have secured at least 60 percent marks in Std XII. (ii) have secured at least 55 percent marks in Graduation in any discipline (iii) have secured at least 60 percent marks in Post-graduate degree/diploma in Management/Economics/Statistics. (iv) be at least 25 years and not be more than 35 years as on 01.03.2010. (v) have post qualification work experience of at least 2 years as General Banking Officer in a bank. (vi) have secured at least 50 percent marks in written examination. (vii) have secured at least 40 percent marks in Personal Interview. In the case of a candidate who satisfies all the above conditions Except----- (a) at (iii) above but has secured at least 60 percent marks in CA or ICWA the case is to be referred to VP-Recruitment. (b) at (vii) above but have secured at least 65 percent marks in the written examination and at least 35 percent marks in the personal interview the case is to be referred to President Recruitment. In each question below are given details of one candidate You have to take one of the following courses of actions based on the information provided and the conditions and sub-conditions given above and mark the number of that course of action as your answer You are not to assume anything other than the information provided in each question All these cases are given to you as on 01.03.2010. Mark answer (a) if the data provided are inadequate to take a decision Mark answer (b) if the case is to be referred to VP- Recruitment Mark answer (c) if the case is to be referred to President Recruitment Mark answer (d) if the candidate is to be selected Mark answer (e) if the candidate is not to be selected.Kesav vora was born on 8th November 1978 He has secured 65 per cent marks in Std. XII and 60 per cent marks in Graduation He has secured 58 percent marks in M.A. Economics and 60 per cent marks in ICWA He has been working in a bank as generalist officer for the past two years after completing his education He has also secured 50 per cent marks in the written examination and 45 percent marks in personal interview.
....
MCQ-> Directions for the next three questions:Answer the following questions based on the information given below: Telecom operators get revenue from transfer of data and voice. Average revenue received from transfer of each unit of data is known as ARDT. In the diagram below, the revenue received form data transfer as percentage of total revenue received and the ARDT in US Dollars (USD) are given for various countries.The X axis represents the ARDT values and the Y axis represents the % of revenue from data transfer as a percentage of the total revenue.
It was found that the volume of data transfer in India is the same as that of Singapore. Then which of the following statements is true?
....
×
×
Type The Issue
×
Your Marks
Terms And Service:We do not guarantee the accuracy of available data ..We Provide Information On Public Data.. Please consult an expert before using this data for commercial or personal use
Powered By:Omega Web Solutions
© 2002-2017 Omega Education PVT LTD...
Privacy
|
Terms And Conditions
 Powered By:Omega Web Solutions
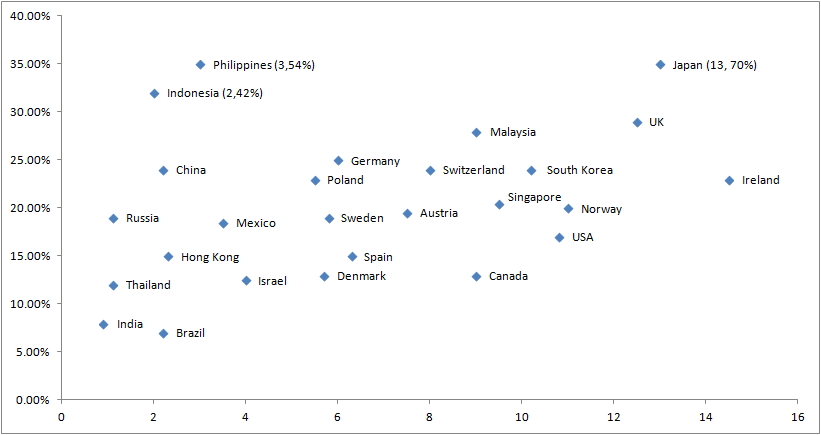 It was found that the volume of data transfer in India is the same as that of Singapore. Then which of the following statements is true?