1. Read the given passage carefully and select the best answer to each question out of the four given alternatives.A growing demand for organics, and the near-total reliance by US farmers on genetically modified corn and soybeans, is driving a surge in imports from other nations where crops largely are free of bioengineering. Imports such as corn from Romania and soybeans from India are booming, according to an analysis of US trade data released Wednesday by the Organic Trade Association and Pennsylvania State University. That shows a potential market for US growers willing to avoid the use of artificial chemicals and genetically modified seeds, said Laura Batcha, chief executive officer of the association, which includes Whole Foods Market Inc., Whitewave Foods Co. and Earthbound Farm LLC. The report is "a help-wanted sign" for US farmers, Batcha said. "There are market distortions that are pretty striking." Most of the corn and soybean shipments become feed for chickens and cows so they can be certified organic under US Department of Agriculture guidelines. Organic poultry and dairy operators shun feed made with seeds from Monsanto Co. and other domestic suppliers in favor of foreign products even as the US remains the world’s top grower of corn and soybeans. As a result, imports to the US of Romanian corn rose to $11.6 million in 2014 from $545,000 the year before. Soybean imports from India more than doubled to $73.8 million. Rising consumer demand in what’s been a niche market is creating shortages, pushing companies that supply farms needing organic feed to seek out foreign sources. About 90% of US corn and soy is bioengineered, thus automatically ineligible for the organic label.What is driving a surge in imports from other nations?


Write Comment

Type in
(Press Ctrl+g to toggle between English and the chosen language)

Comments

Show Similar Question And Answers
QA->In a club 70% members read English news papers and 75% members read Malayalam news papers, while 20% do not read both papers. If 325 members read both the news papers, then the total numbers in the club is .........?....
QA->Which country has recently signed $10 billion (nearly Rs.44, 000 crore) worth deals with U.S.A for creating more than 50,000 jobs back in the U.S?....
QA->After Punjab, Delhi and Andhra Pradesh, which is the fourth state to give permission to conduct field trials of genetically modified (GM) crops?....
QA->What kind of pension can be given if a post held by an Officer is abolished and the officer is not willing to accept another appointment?....
QA->U.S.President Obama recently blocked Chinese Owned Corporation from acquiring ownership of four wind farm companies in Oregon near a U.S. naval weapons systems training facility due to national security concerns. Name that corporation?....
MCQ-> Read the given passage carefully and select the best answer to each question out of the four given alternatives.A growing demand for organics, and the near-total reliance by US farmers on genetically modified corn and soybeans, is driving a surge in imports from other nations where crops largely are free of bioengineering. Imports such as corn from Romania and soybeans from India are booming, according to an analysis of US trade data released Wednesday by the Organic Trade Association and Pennsylvania State University. That shows a potential market for US growers willing to avoid the use of artificial chemicals and genetically modified seeds, said Laura Batcha, chief executive officer of the association, which includes Whole Foods Market Inc., Whitewave Foods Co. and Earthbound Farm LLC. The report is "a help-wanted sign" for US farmers, Batcha said. "There are market distortions that are pretty striking." Most of the corn and soybean shipments become feed for chickens and cows so they can be certified organic under US Department of Agriculture guidelines. Organic poultry and dairy operators shun feed made with seeds from Monsanto Co. and other domestic suppliers in favor of foreign products even as the US remains the world’s top grower of corn and soybeans. As a result, imports to the US of Romanian corn rose to $11.6 million in 2014 from $545,000 the year before. Soybean imports from India more than doubled to $73.8 million. Rising consumer demand in what’s been a niche market is creating shortages, pushing companies that supply farms needing organic feed to seek out foreign sources. About 90% of US corn and soy is bioengineered, thus automatically ineligible for the organic label.What is driving a surge in imports from other nations?
 ....
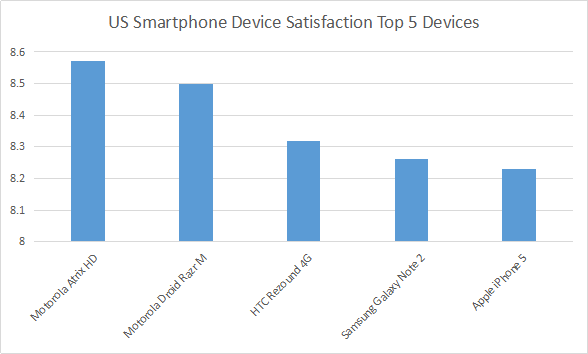
MCQ-> Please read the three reports (newspaper articles) on ranking of different players and products in smart phones industry and answer the questions that follow. Report 1: (Feb, 2013) Apple nabs crown as current top US mobile phone vendor Apple’s reign may not be long, as Samsung is poised to overtake Apple in April, 2013. For the first time since Apple entered the mobile phone market in 2007, it has been ranked the top mobile phone vendor in the US. For the latter quarter of 2012, sales of its iPhone accounted for 34 percent of all mobile phone sales in the US - including feature phones - according to the latest data from Strategy Analytics. While the iPhone has consistently been ranked the top smartphone sold in the US, market research firm NPD noted that feature phone sales have fallen off a cliff recently, to the point where 8 out of every 10 mobile phones sold in the US are now smartphones. That ratio is up considerably from the end of 2011, when smartphones had just cracked the 50 percent mark. Given this fact it’s no surprise that Apple, which only sells smartphones, has been able to reach the top of the overall mobile phone market domestically. For the fourth quarter of 2012, Apple ranked number one with 34 percent of the US mobile market, up from 25.6 percent year over year. Samsung grew similarly, up to 32.3 percent from 26.9 percent - but not enough to keep from slipping to second place. LG dropped to 9 percent from 13.7 percent, holding its third place spot. It should be noted that Samsung and LG both sell a variety of feature phones in addition to smartphones. Looking only at smartphones, the ranking is a little different according to NPD. Apple holds the top spot with 39 percent of the US smartphone market, while Samsung again sits at number two with 30 percent. Motorola manages to rank third with 7 percent, while HTC dropped to fourth with 6 percent. In the US smartphone market, LG is fifth with 6 percent. Note how the percentages aren’t all that different from overall mobile phone market share - for all intents and purposes, the smartphone market is the mobile phone market in the US going forward. Still, Samsung was the top mobile phone vendor overall for 2012, and Strategy Analytics expects Samsung to be back on top soon. “Samsung had been the number one mobile phone vendor in the US since 2008, and it will surely be keen to recapture that title in 2013 by launching improved new models such as the rumored Galaxy S4”. And while Apple is the top vendor overall among smartphones, its iOS platform is still second to the Android platform overall. Samsung is the largest vendor selling Android-based smartphones, but Motorola, HTC, LG, and others also sell Android devices, giving the platform a clear advantage over iOS both domestically and globally. Report 2: Reader’s Response (2013, Feb) I don’t actually believe the numbers for Samsung. Ever since the debacle in early 2011, when Lenovo called into question the numbers Samsung was touting for tablet shipments, stating that Samsung had only sold 20,000 of the 1.5 million tablets they shipped into the US the last quarter of 2010, Samsung (who had no response to Lenovo) has refused to supply quarterly sales numbers for smartphones or tablets. That’s an indication that their sales aren’t what analysts are saying. We can look to several things to help understand why. In the lawsuit between Apple and Samsung here last year, both were required to supply real sales numbers for devices under contention. The phones listed turned out to have sales between one third and one half of what had been guessed by IDC and others. Tablet sales were even worse. Of the 1.5 million tablets supposedly shipped to the US during that time, only 38,000 were sold. Then we have the usage numbers. Samsung tablets have only a 1.5% usage rate, where the iPad has over 90%. Not as much a difference with the phones but it’s still overwhelmingly in favor of iPhone. The problem is that with Apple’s sales, we have actual numbers to go by. The companies who estimate can calibrate what they do after those numbers come out. But with Samsung and many others, they can’t ever calibrate their methods, as there are no confirming numbers released from the firms. A few quarters ago, as a result, we saw iSupply estimate Samsung’s smartphone sales for the quarter at 32 million, with estimates from others all over the place up to 50 million. Each time some other company reported a higher number for that same quarter, the press dutifully used that higher number as THE ONE. But none of them was the one. Without accurate self-reporting of actual sales to the end users, none of these market share charts are worth a damn! Report 3: Contradictory survey (Feb, 2013) iPhone5 Ranks Fifth In U.S. Customer Satisfaction Survey inShare. The iPhone5 ranks fifth in customer satisfaction according to the results of a recent survey from OnDevice Research, a mobile device research group. In the poll, they asked 320,000 smartphone and tablet users from six different countries, how satisfied they were with their devices. According to 93,825 people from the US, Motorola Atrix HD is the most satisfying and Motorola’s Droid Razr took second spot. HTC Corp (TPE : 2498)’s Rezound 4G and Samsung Galaxy Note 2 took third and fourth spots, while Apple’s iPhone5 landed in fifth spot. It appears that Apple may be lagging in consumer interest. OnDevice Research, Sarah Quinn explained, “Although Apple created one of the most revolutionary devices of the past decade, other manufactures have caught up, with some Android powered devices now commanding higher levels of user satisfaction.” Despite the lower rankings, things aren’t looking too bad for Apple Inc. (NASDAQ:AAPL) elsewhere. In the United Kingdom, they ranked second place, right after HTC One X. Interesting enough, Apple did take top spot for overall satisfaction of mobile device, whereas Google Inc. (NASDAQ:GOOG) ranked second. Motorola Mobility Holdings Inc. (NYSE:NOK) took third, fourth, and fifth places respectively, while Sony Ericsson trailed behind at sixth place. The survey sampled mobile device users in the following countries: United States, United Kingdom, France, Germany, Japan, and Indonesia. Although OnDevice didn’t share the full list of devices mentioned in the survey, it does show some insight to what customers want. Unfortunately, there were still many questions regarding the survey that were left unanswered. Everyone wants to know why Google Inc. (NASDAQ:GOOG) was on the list when they are not an actual smartphone maker and why was Samsung Electronics Co., Ltd. (LON:BC94) on the bottom of the satisfaction list when the brand is leading elsewhere. Source: 92.825 US mobile users, July 2012 - January 2013 Fortunately, those questions were answered by OnDevice Research’s representative. He explained that the survey was conducted on mobile web where the survey software could detect the taker’s device and since user’s rate their satisfaction levels on a 1 to 10 scale, thanks to the Nexus device, Google was included.If you analyze the three reports above, which of the following statements would be the best inference?
 ....
MCQ-> The current debate on intellectual property rights (IPRs) raises a number of important issues concerning the strategy and policies for building a more dynamic national agricultural research system, the relative roles of public and private sectors, and the role of agribusiness multinational corporations (MNCs). This debate has been stimulated by the international agreement on Trade Related Intellectual Property Rights (TRIPs), negotiated as part of the Uruguay Round. TRIPs, for the first time, seeks to bring innovations in agricultural technology under a new worldwide IPR regime. The agribusiness MNCs (along with pharmaceutical companies) played a leading part in lobbying for such a regime during the Uruguay Round negotiations. The argument was that incentives are necessary to stimulate innovations, and that this calls for a system of patents which gives innovators the sole right to use (or sell/lease the right to use) their innovations for a specified period and protects them against unauthorised copying or use. With strong support of their national governments, they were influential in shaping the agreement on TRIPs, which eventually emerged from the Uruguay Round. The current debate on TRIPs in India - as indeed elsewhere - echoes wider concerns about ‘privatisation’ of research and allowing a free field for MNCs in the sphere of biotechnology and agriculture. The agribusiness corporations, and those with unbounded faith in the power of science to overcome all likely problems, point to the vast potential that new technology holds for solving the problems of hunger, malnutrition and poverty in the world. The exploitation of this potential should be encouraged and this is best done by the private sector for which patents are essential. Some, who do not necessarily accept this optimism, argue that fears of MNC domination are exaggerated and that farmers will accept their products only if they decisively outperform the available alternatives. Those who argue against agreeing to introduce an IPR regime in agriculture and encouraging private sector research are apprehensive that this will work to the disadvantage of farmers by making them more and more dependent on monopolistic MNCs. A different, though related apprehension is that extensive use of hybrids and genetically engineered new varieties might increase the vulnerability of agriculture to outbreaks of pests and diseases. The larger, longer-term consequences of reduced biodiversity that may follow from the use of specially bred varieties are also another cause for concern. Moreover, corporations, driven by the profit motive, will necessarily tend to underplay, if not ignore, potential adverse consequences, especially those which are unknown and which may manifest themselves only over a relatively long period. On the other hand, high-pressure advertising and aggressive sales campaigns by private companies can seduce farmers into accepting varieties without being aware of potential adverse effects and the possibility of disastrous consequences for their livelihood if these varieties happen to fail. There is no provision under the laws, as they now exist, for compensating users against such eventualities. Excessive preoccupation with seeds and seed material has obscured other important issues involved in reviewing the research policy. We need to remind ourselves that improved varieties by themselves are not sufficient for sustained growth of yields. in our own experience, some of the early high yielding varieties (HYVs) of rice and wheat were found susceptible to widespread pest attacks; and some had problems of grain quality. Further research was necessary to solve these problems. This largely successful research was almost entirely done in public research institutions. Of course, it could in principle have been done by private companies, but whether they choose to do so depends crucially on the extent of the loss in market for their original introductions on account of the above factors and whether the companies are financially strong enough to absorb the ‘losses’, invest in research to correct the deficiencies and recover the lost market. Public research, which is not driven by profit, is better placed to take corrective action. Research for improving common pool resource management, maintaining ecological health and ensuring sustainability is both critical and also demanding in terms of technological challenge and resource requirements. As such research is crucial to the impact of new varieties, chemicals and equipment in the farmer’s field, private companies should be interested in such research. But their primary interest is in the sale of seed materials, chemicals, equipment and other inputs produced by them. Knowledge and techniques for resource management are not ‘marketable’ in the same way as those inputs. Their application to land, water and forests has a long gestation and their efficacy depends on resolving difficult problems such as designing institutions for proper and equitable management of common pool resources. Public or quasi-public research institutions informed by broader, long-term concerns can only do such work. The public sector must therefore continue to play a major role in the national research system. It is both wrong and misleading to pose the problem in terms of public sector versus private sector or of privatisation of research. We need to address problems likely to arise on account of the public-private sector complementarity, and ensure that the public research system performs efficiently. Complementarity between various elements of research raises several issues in implementing an IPR regime. Private companies do not produce new varieties and inputs entirely as a result of their own research. Almost all technological improvement is based on knowledge and experience accumulated from the past, and the results of basic and applied research in public and quasi-public institutions (universities, research organisations). Moreover, as is increasingly recognised, accumulated stock of knowledge does not reside only in the scientific community and its academic publications, but is also widely diffused in traditions and folk knowledge of local communities all over. The deciphering of the structure and functioning of DNA forms the basis of much of modern biotechnology. But this fundamental breakthrough is a ‘public good’ freely accessible in the public domain and usable free of any charge. Various techniques developed using that knowledge can however be, and are, patented for private profit. Similarly, private corporations draw extensively, and without any charge, on germplasm available in varieties of plants species (neem and turmeric are by now famous examples). Publicly funded gene banks as well as new varieties bred by public sector research stations can also be used freely by private enterprises for developing their own varieties and seek patent protection for them. Should private breeders be allowed free use of basic scientific discoveries? Should the repositories of traditional knowledge and germplasm be collected which are maintained and improved by publicly funded organisations? Or should users be made to pay for such use? If they are to pay, what should be the basis of compensation? Should the compensation be for individuals or (or communities/institutions to which they belong? Should individual institutions be given the right of patenting their innovations? These are some of the important issues that deserve more attention than they now get and need serious detailed study to evolve reasonably satisfactory, fair and workable solutions. Finally, the tendency to equate the public sector with the government is wrong. The public space is much wider than government departments and includes co- operatives, universities, public trusts and a variety of non-governmental organisations (NGOs). Giving greater autonomy to research organisations from government control and giving non- government public institutions the space and resources to play a larger, more effective role in research, is therefore an issue of direct relevance in restructuring the public research system.Which one of the following statements describes an important issue, or important issues, not being raised in the context of the current debate on IPRs?
 ....
MCQ-> The broad scientific understanding today is that our planet is experiencing a warming trend over and above natural and normal variations that is almost certainly due to human activities associated with large-scale manufacturing. The process began in the late 1700s with the Industrial Revolution, when manual labor, horsepower, and water power began to be replaced by or enhanced by machines. This revolution, over time, shifted Britain, Europe, and eventually North America from largely agricultural and trading societies to manufacturing ones, relying on machinery and engines rather than tools and animals.The Industrial Revolution was at heart a revolution in the use of energy and power. Its beginning is usually dated to the advent of the steam engine, which was based on the conversion of chemical energy in wood or coal to thermal energy and then to mechanical work primarily the powering of industrial machinery and steam locomotives. Coal eventually supplanted wood because, pound for pound, coal contains twice as much energy as wood (measured in BTUs, or British thermal units, per pound) and because its use helped to save what was left of the world's temperate forests. Coal was used to produce heat that went directly into industrial processes, including metallurgy, and to warm buildings, as well as to power steam engines. When crude oil came along in the mid- 1800s, still a couple of decades before electricity, it was burned, in the form of kerosene, in lamps to make light replacing whale oil. It was also used to provide heat for buildings and in manufacturing processes, and as a fuel for engines used in industry and propulsion.In short, one can say that the main forms in which humans need and use energy are for light, heat, mechanical work and motive power, and electricity which can be used to provide any of the other three, as well as to do things that none of those three can do, such as electronic communications and information processing. Since the Industrial Revolution, all these energy functions have been powered primarily, but not exclusively, by fossil fuels that emit carbon dioxide (CO2), To put it another way, the Industrial Revolution gave a whole new prominence to what Rochelle Lefkowitz, president of Pro-Media Communications and an energy buff, calls "fuels from hell" - coal, oil, and natural gas. All these fuels from hell come from underground, are exhaustible, and emit CO2 and other pollutants when they are burned for transportation, heating, and industrial use. These fuels are in contrast to what Lefkowitz calls "fuels from heaven" -wind, hydroelectric, tidal, biomass, and solar power. These all come from above ground, are endlessly renewable, and produce no harmful emissions.Meanwhile, industrialization promoted urbanization, and urbanization eventually gave birth to suburbanization. This trend, which was repeated across America, nurtured the development of the American car culture, the building of a national highway system, and a mushrooming of suburbs around American cities, which rewove the fabric of American life. Many other developed and developing countries followed the American model, with all its upsides and downsides. The result is that today we have suburbs and ribbons of highways that run in, out, and around not only America s major cities, but China's, India's, and South America's as well. And as these urban areas attract more people, the sprawl extends in every direction.All the coal, oil, and natural gas inputs for this new economic model seemed relatively cheap, relatively inexhaustible, and relatively harmless-or at least relatively easy to clean up afterward. So there wasn't much to stop the juggernaut of more people and more development and more concrete and more buildings and more cars and more coal, oil, and gas needed to build and power them. Summing it all up, Andy Karsner, the Department of Energy's assistant secretary for energy efficiency and renewable energy, once said to me: "We built a really inefficient environment with the greatest efficiency ever known to man."Beginning in the second half of the twentieth century, a scientific understanding began to emerge that an excessive accumulation of largely invisible pollutants-called greenhouse gases - was affecting the climate. The buildup of these greenhouse gases had been under way since the start of the Industrial Revolution in a place we could not see and in a form we could not touch or smell. These greenhouse gases, primarily carbon dioxide emitted from human industrial, residential, and transportation sources, were not piling up along roadsides or in rivers, in cans or empty bottles, but, rather, above our heads, in the earth's atmosphere. If the earth's atmosphere was like a blanket that helped to regulate the planet's temperature, the CO2 buildup was having the effect of thickening that blanket and making the globe warmer.Those bags of CO2 from our cars float up and stay in the atmosphere, along with bags of CO2 from power plants burning coal, oil, and gas, and bags of CO2 released from the burning and clearing of forests, which releases all the carbon stored in trees, plants, and soil. In fact, many people don't realize that deforestation in places like Indonesia and Brazil is responsible for more CO2 than all the world's cars, trucks, planes, ships, and trains combined - that is, about 20 percent of all global emissions. And when we're not tossing bags of carbon dioxide into the atmosphere, we're throwing up other greenhouse gases, like methane (CH4) released from rice farming, petroleum drilling, coal mining, animal defecation, solid waste landfill sites, and yes, even from cattle belching. Cattle belching? That's right-the striking thing about greenhouse gases is the diversity of sources that emit them. A herd of cattle belching can be worse than a highway full of Hummers. Livestock gas is very high in methane, which, like CO2, is colorless and odorless. And like CO2, methane is one of those greenhouse gases that, once released into the atmosphere, also absorb heat radiating from the earth's surface. "Molecule for molecule, methane's heat-trapping power in the atmosphere is twenty-one times stronger than carbon dioxide, the most abundant greenhouse gas.." reported Science World (January 21, 2002). “With 1.3 billion cows belching almost constantly around the world (100 million in the United States alone), it's no surprise that methane released by livestock is one of the chief global sources of the gas, according to the U.S. Environmental Protection Agency ... 'It's part of their normal digestion process,' says Tom Wirth of the EPA. 'When they chew their cud, they regurgitate [spit up] some food to rechew it, and all this gas comes out.' The average cow expels 600 liters of methane a day, climate researchers report." What is the precise scientific relationship between these expanded greenhouse gas emissions and global warming? Experts at the Pew Center on Climate Change offer a handy summary in their report "Climate Change 101. " Global average temperatures, notes the Pew study, "have experienced natural shifts throughout human history. For example; the climate of the Northern Hemisphere varied from a relatively warm period between the eleventh and fifteenth centuries to a period of cooler temperatures between the seventeenth century and the middle of the nineteenth century. However, scientists studying the rapid rise in global temperatures during the late twentieth century say that natural variability cannot account for what is happening now." The new factor is the human factor-our vastly increased emissions of carbon dioxide and other greenhouse gases from the burning of fossil fuels such as coal and oil as well as from deforestation, large-scale cattle-grazing, agriculture, and industrialization.“Scientists refer to what has been happening in the earth’s atmosphere over the past century as the ‘enhanced greenhouse effect’”, notes the Pew study. By pumping man- made greenhouse gases into the atmosphere, humans are altering the process by which naturally occurring greenhouse gases, because of their unique molecular structure, trap the sun’s heat near the earth’s surface before that heat radiates back into space."The greenhouse effect keeps the earth warm and habitable; without it, the earth's surface would be about 60 degrees Fahrenheit colder on average. Since the average temperature of the earth is about 45 degrees Fahrenheit, the natural greenhouse effect is clearly a good thing. But the enhanced greenhouse effect means even more of the sun's heat is trapped, causing global temperatures to rise. Among the many scientific studies providing clear evidence that an enhanced greenhouse effect is under way was a 2005 report from NASA's Goddard Institute for Space Studies. Using satellites, data from buoys, and computer models to study the earth's oceans, scientists concluded that more energy is being absorbed from the sun than is emitted back to space, throwing the earth's energy out of balance and warming the globe."Which of the following statements is correct? (I) Greenhouse gases are responsible for global warming. They should be eliminated to save the planet (II) CO2 is the most dangerous of the greenhouse gases. Reduction in the release of CO2 would surely bring down the temperature (III) The greenhouse effect could be traced back to the industrial revolution. But the current development and the patterns of life have enhanced their emissions (IV) Deforestation has been one of the biggest factors contributing to the emission of greenhouse gases Choose the correct option:....
MCQ-> Read the following passage carefully and answer the questions given below it. Certain words/phrases have been printed in bold tohelp you locate them while answering some of the questions. During the last few years, a lot of hype has been heaped on the BRICS (Brazil, Russia, India, China, and South Africa). With their large populations and rapid growth, these countries, so the argument goes, will soon become some of the largest economies in the world and, in the case of China, the largest of all by as early as 2020. But the BRICS, as well as many other emerging-market economieshave recently experienced a sharp economic slowdown. So, is the honeymoon over? Brazil’s GDP grew by only 1% last year, and may not grow by more than 2% this year, with its potential growth barely above 3%. Russia’s economy may grow by barely 2% this year, with potential growth also at around 3%, despite oil prices being around $100 a barrel. India had a couple of years of strong growth recently (11.2% in 2010 and 7.7% in 2011) but slowed to 4% in 2012. China’s economy grew by 10% a year for the last three decades, but slowed to 7.8% last year and risks a hard landing. And South Africa grew by only 2.5% last year and may not grow faster than 2% this year. Many other previously fast-growing emerging-market economies – for example, Turkey, Argentina, Poland, Hungary, and many in Central and Eastern Europe are experiencing a similar slowdown. So, what is ailing the BRICS and other emerging markets? First, most emerging-market economies were overheating in 2010-2011, with growth above potential and inflation rising and exceeding targets. Many of them thus tightened monetary policy in 2011, with consequences for growth in 2012 that have carried over into this year. Second, the idea that emerging-market economies could fully decouple from economic weakness in advanced economies was farfetched : recession in the eurozone, near-recession in the United Kingdom and Japan in 2011-2012, and slow economic growth in the United States were always likely to affect emerging market performance negatively – via trade, financial links, and investor confidence. For example, the ongoing euro zone downturn has hurt Turkey and emergingmarket economies in Central and Eastern Europe, owing to trade links. Third, most BRICS and a few other emerging markets have moved toward a variant of state capitalism. This implies a slowdown in reforms that increase the private sector’s productivity and economic share, together with a greater economic role for state-owned enterprises (and for state-owned banks in the allocation of credit and savings), as well as resource nationalism, trade protectionism, import substitution industrialization policies, and imposition of capital controls. This approach may have worked at earlier stages of development and when the global financial crisis caused private spending to fall; but it is now distorting economic activity and depressing potential growth. Indeed, China’s slowdown reflects an economic model that is, as former Premier Wen Jiabao put it, “unstable, unbalanced, uncoordinated, and unsustainable,” and that now is adversely affecting growth in emerging Asia and in commodity-exporting emerging markets from Asia to Latin America and Africa. The risk that China will experience a hard landing in the next two years may further hurt many emerging economies. Fourth, the commodity super-cycle that helped Brazil, Russia, South Africa, and many other commodity-exporting emerging markets may be over. Indeed, a boom would be difficult to sustain, given China’s slowdown, higher investment in energysaving technologies, less emphasis on capital-and resource-oriented growth models around the world, and the delayed increase in supply that high prices induced. The fifth, and most recent, factor is the US Federal Reserve’s signals that it might end its policy of quantitative easing earlier than expected, and its hints of an even tual exit from zero interest rates. both of which have caused turbulence in emerging economies’ financial markets. Even before the Fed’s signals, emergingmarket equities and commodities had underperformed this year, owing to China’s slowdown. Since then, emerging-market currencies and fixed-income securities (government and corporate bonds) have taken a hit. The era of cheap or zerointerest money that led to a wall of liquidity chasing high yields and assets equities, bonds, currencies, and commodities – in emerging markets is drawing to a close. Finally, while many emerging-market economies tend to run current-account surpluses, a growing number of them – including Turkey, South Africa, Brazil, and India – are running deficits. And these deficits are now being financed in riskier ways: more debt than equity; more short-term debt than longterm debt; more foreign-currency debt than local-currency debt; and more financing from fickle cross-border interbank flows. These countries share other weaknesses as well: excessive fiscal deficits, abovetarget inflation, and stability risk (reflected not only in the recent political turmoil in Brazil and Turkey, but also in South Africa’s labour strife and India’s political and electoral uncertainties). The need to finance the external deficit and to avoid excessive depreciation (and even higher inflation) calls for raising policy rates or keeping them on hold at high levels. But monetary tightening would weaken already-slow growth. Thus, emerging economies with large twin deficits and other macroeconomic fragilities may experience further downward pressure on their financial markets and growth rates. These factors explain why growth in most BRICS and many other emerging markets has slowed sharply. Some factors are cyclical, but others – state capitalism, the risk of a hard landing in China, the end of the commodity supercycle -are more structural. Thus, many emerging markets’ growth rates in the next decade may be lower than in the last – as may the outsize returns that investors realised from these economies’ financial assets (currencies, equities. bonds, and commodities). Of course, some of the better-managed emerging-market economies will continue to experitnce rapid growth and asset outperformance. But many of the BRICS, along with some other emerging economies, may hit a thick wall, with growth and financial markets taking a serious beating.Which of the following statement(s) is/are true as per the given information in the passage ? A. Brazil’s GDP grew by only 1% last year, and is expected to grow by approximately 2% this year. B. China’s economy grew by 10% a year for the last three decades but slowed to 7.8% last year. C. BRICS is a group of nations — Barzil, Russia, India China and South Africa.....
Terms And Service:We do not guarantee the accuracy of available data ..We Provide Information On Public Data.. Please consult an expert before using this data for commercial or personal use
DMCA.com Protection Status Powered By:Omega Web Solutions
© 2002-2017 Omega Education PVT LTD...Privacy | Terms And Conditions