1.
The pie chart given below shows the runs scored by a player against 6 different countries. The total runs scored by the player against these countries are 1600. 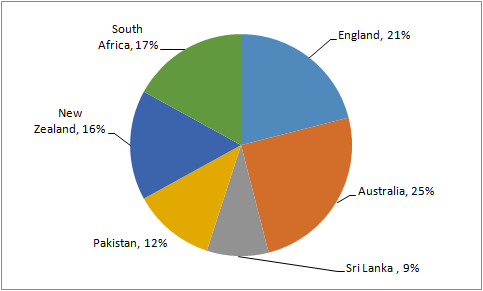 How many runs has the player scored against Pakistan?
Write Comment
Comments
- By: anil on 05 May 2019 01.46 am% runs scored against Pakistan = 12% Total runs scored = 1600 => Runs scored against Pakistan = $$frac{12}{100} imes1600=192$$ => Ans - (B)
Show Similar Question And Answers
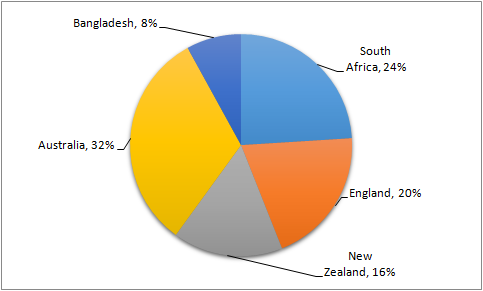 The runs scored by Pujara against South Africa is more than runs scored against Bangladesh by what percentage?
....
The runs scored by Pujara against South Africa is more than runs scored against Bangladesh by what percentage?
.... Break-up of Number of Males in Each Department
Total number of males in the Organisation = 2,040
Break-up of Number of Males Working in Each Department
Break-up of Number of Males in Each Department
Total number of males in the Organisation = 2,040
Break-up of Number of Males Working in Each Department  Break-up of Number of employees
who recently Got Promoted in each Department
Total number of Employees who got promoted = 1,200
Number of Employees who recently Got Promoted from Each Department
Break-up of Number of employees
who recently Got Promoted in each Department
Total number of Employees who got promoted = 1,200
Number of Employees who recently Got Promoted from Each Department If half of the number of employees who got promoted from the IT department were males what was the approximate percentage of males who got promoted from the IT department ?