1.
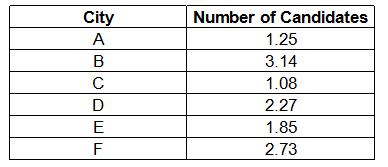
Study the following graph carefully to answer the questions. What is the respective ratio of the number of candidates appearing for the Entrance Test from city A and city D in the year 2008?
Show Similar Question And Answers
 Ratio of candidates passing and failing within the city
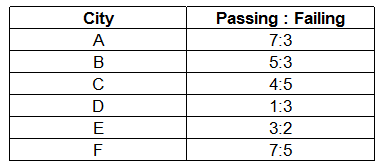 What is the ratio of the number of candidates failing the exam from City D to that of those failing the exam from City A ?
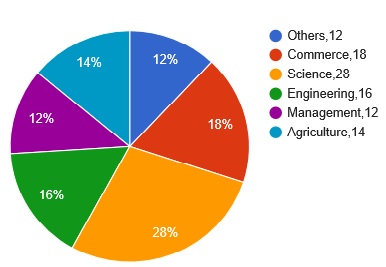 Discipline Wise Break up of Number of candidates selected after Interview by organisation
Total Number of Candidates selected After
Interview=7390 percentage
Discipline Wise Break up of Number of candidates selected after Interview by organisation
Total Number of Candidates selected After
Interview=7390 percentage
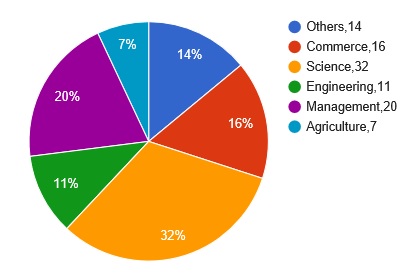 What was the ratio between the number of candidates appeared in interview from other disciplines and number of candidates selected from Engineering discipline respectively