Toggle navigation
Home
Article Category
Question Papers
General Knowlege
Popular Pages
Multiple Choice Question in
Multiple Choice Question in 049
Multiple Choice Question in 2016
Multiple Choice Question in -current-affairs-2016
Multiple Choice Question in TRADES-INSTRUCTOR---GR-II---SMITHY---TECHNICAL-EDUCATION
Question Answer in ASSISTANT-PROFESSOR---COMPUTER-SCIENCE-AND-ENGINEERING---TECHNICAL-EDUCATION
Multiple Choice Question in ASSISTANT-PROFESSOR---COMPUTER-SCIENCE-AND-ENGINEERING---TECHNICAL-EDUCATION
Multiple Choice Question in english
Multiple Choice Question in abbreviations-abbreviations-m
Multiple Choice Question in SSC CHSL 7 March 2018 Morning Shift
Multiple Choice Question in 072/2016
Question Answer Bank
Multiple Choice Question Bank
Question Answer Category
Multiple Choice Question Category
Home
->
Multiple Choice Questions
1. Under economic environmental analysis_____________explains the relation between lax rateand tax revenue.
(A): 5 curve
(B): Paasche's index
(C): Lorenz curve
(D): l affer curve
Previous Question
Show Answer
Next Question
Add Tags
Report Error
Show Marks
Write Comment
Type in
(Press Ctrl+g to toggle between English and the chosen language)
Post reply
Comments
Tags
kerala-psc
ACCOUNTS-OFFICER-KERALA-CO-OPERATIVE-MILK-MARKETING-FEDERATION
02/2015
Show Similar Question And Answers
QA->The GSTcouncil in November 2016 approved four tier tax structure under the Goods andServices Tax (GST). What is that four tier tax structure?....
QA->An attribute or set of attributes within one relation that matches the candidate key of some (possibly the same. relation:....
QA->Social and environmental activist who has won the prestigious Goldman Environmental Prize-2017, dubbed as the Green Nobel?....
QA->The tax imposed under the provisions of the Kerala Land Tax Act.1961 is :....
QA->Whichcountry has on December 25, 2016, passed an environmental tax law onenterprises and other public institutions to curb pollution level in the country?....
MCQ->Under economic environmental analysis_____________explains the relation between lax rateand tax revenue.....
MCQ-> Read the following passage carefully and answer the questions given. Certain words/phrases have been given in bold to help you locate them while answering some of the questions. From a technical and economic perspective, many assessments have highlighted the presence of cost-effective opportunities to reduce energy use in buildings. However several bodies note the significance of multiple barriers that prevent the take-up of energy efficiency measures in buildings. These include lack of awareness and concern, limited access to reliable information from trusted sources, fear about risk, disruption and other ‘transaction costs’ concerns about up-front costs and inadequate access to suitably priced finance, a lack of confidence in suppliers and technologies and the presence of split incentives between landlords and tenants. The widespread presence of these barriers led experts to predict thatwithout a
concerted
push from policy, two-thirds of the economically viable potential to improve energy efficiency will remain
unexploited
by 2035. These barriers are
albatross around the neck
that represent a classic market failure and a basis for governmental intervention. While these measurements focus on the technical, financial or economic barriers preventing the take-up of energy efficiency options in buildings, others emphasise the significance of the often deeply embedded social practices that shape energy use in buildings. These analyses focus not on the preferences and rationalities that might shape individual behaviours, but on the ‘entangled’ cultural practices, norms, values and routines that
underpin
domestic energy use. Focusing on the practice-related aspects of consumption generates very different conceptual framings and policy prescriptions than those that emerge from more traditional or mainstream perspectives. But the underlying case for government intervention to help to promote retrofit and the diffusion of more energy efficient particles is still apparent, even though the forms of intervention advocated are often very different to those that emerge from a more technical or economic perspective. Based on the recognition of the multiple barriers to change and the social, economic and environmental benefits that could be realised if they were overcome, government support for retrofit (renovating existing infrastructure to make it more energy efficient) has been widespread. Retrofit programmes have been supported and adopted in diverse forms in many setting and their ability to recruit householders and then to impact their energy use has been discussed quite extensively. Frequently, these discussions have criticised the extent to which retrofit schemes rely on incentives and the provision of new technologies to change behaviour whilst ignoring the many other factors that might limit either participation in the schemes or their impact on the behaviours and prac-tices that shape domestic energy use. These factors are obviously central to the success of retrofit schemes, but evaluations of different schemes have found that despite these they can still have significant impacts. Few experts that the best estimate of the gap between the technical potential and the actual in-situ performance of energy efficiency measures is 50%, with 35% coming from performance gaps and 15% coming from ‘comfort taking’ or direct rebound effects. They further suggest that the direct rebound effect of energy efficiency measures related to household heating is Ilkley to be less than 30% while rebound effects for various domestic energy efficiency measures vary from 5 to 15% and arise mostly from indirect effects (i.e., where savings from energy efficiency lead to increased demand for goods and services). Other analyses also note that the gap between technical potential and actual performance is likely to vary by measure, with the range extending from 0% for measures such as solar water heating to 50% for measures such as improved heating controls. And others note that levels of comfort taking are likely to vary according to the levels of consumption and fuel poverty in the sample of homes where insulation is installed, with the range extending from 30% when considering homes across all income groups to around 60% when considering only lower income homes. The scale of these gapsis significant because it materially affects the impacts of retrofit schemes and expectations and perceptions of these impacts go on to influence levels of political, financial and public support for these schemes. The literature on retrofit highlights the presence of multiple barriers to change and the need for government support, if these are to be overcome. Although much has been written on the extent to which different forms of support enable the wider take-up of domestic energy efficiency measures, behaviours and practices, various areas of contestation remain and there is still an absence of
robust
ex-post evidence on the extent to which these schemes actually do lead to the social, economic and environmental benefits that are widely claimed.Which of the following is most nearly the OPPOSITE in meaning to the word ‘CONCERTED’ as used in the passage ?
....
MCQ->As we all know Govt. of Indiacollects tax revenue on variousactivities in the country. Whichof the following is a part of thetax revenue of the Govt. ? (i) Tax on Income(ii) Tax on Expenditure(iii) Tax on Property or CapitalAsset(iv) Tax on Goods and Services....
MCQ->
Read the passage given below and answer the questions that follow:-
Brazil is a top exporter of every commodity that has seen dizzying price surges - iron ore, soybeans, sugar - producing a golden age for economic growth Foreign money-flows into Brazilian stocks and bonds climbed heavenward, up more than tenfold, from $5 billion a year in early 2007 to more than $50 billion in the twelve months through March 2011.The flood of foreign money buying up Brazilian assets has made the currency one of the most expensive in the world, and Brazil one of the most costly, overhyped economies. Almost every major emerging- market currency has strengthened against the dollar over the last decade, but the Brazilian Real is on a path alone, way above the pack, having doubled in value against the dollar.Economists have all kinds of fancy ways to measure the real value of a currency, but when a country is pricing itself this far out of the competition, you can feel it on the ground. In early 2011 the major Rio paper, 0 Globo, ran a story on prices showing that croissants are more expensive than they are in Paris, haircuts cost more than they do in London, bike rentals are more expensive than in Amsterdam, and movie tickets sell for higher prices than in Madrid. A rule of the road: if the local prices in an emerging market country feel expensive even to a visitor from a rich nation, that country is probably not a breakout nation.There is no better example of how absurd it is to lump all the big emerging markets together than the frequent pairing of Brazil and China. Those who make this comparison are referring only to the fact that they are the biggest players in their home regions, not to the way the economies actually run. Brazil is the world‘s leading exporter of many raw materials, and China is the leading importer; that makes them major trade partners - China surpassed the United States as Brazil's leading trade partner in 2009 f but it also makes them opposites in almost every important economic respect: Brazil is the un-China, with interest rates that are too high, and a currency that is too expensive. It spends too little on roads and too much on welfare, and as a result has a very un-China-like growth record.It may not be entirely fair to compare economic growth in Brazil with that of its Asian counterparts, because Brazil has a per capita income of $12,000, more than two times China's and nearly ten times India's. But even taking into account the fact that it is harder for rich nations to grow quickly, Brazil's growth has been disappointing. Since the early 19805 the Brazilian growth rate has oscillated around an average of 2.5 percent, spiking only in concert with increased prices for Brazil's key commodity exports. While China has been criticized for pursuing "growth at any cost," Brazil has sought to secure "stability at any cost." Brazil's caution stems from its history of financial crises, in which overspending produced debt, humiliating defaults, and embarrassing devaluations, culminating in a disaster that is still recent enough to be fresh in every Brazilian adult's memory: the hyperinflation that started in the early 19805 and peaked in 1994, at the vertiginous annual rate of 2,100 percent.Wages were pegged to inflation but were increased at varying intervals in different industries, 50 workers never really knew whether they were making good money or not. As soon as they were paid, they literally ran to the store with cash to buy food, and they could afford little else, causing non-essential industries to start to die. Hyperinflation finally came under control in l995, but it left a problem of regular behind. Brazil has battled inflation ever since by maintaining one of the highest interest rates in the emerging world. Those high rates have attracted a surge of foreign money, which is partly why the Brazilian Real is so expensive relative to comparable currencies.There is a growing recognition that China faces serious "imbalances" that could derail its long economic boom. Obsessed until recently with high growth, China has been pushing too hard to keep its currency too cheap (to help its export industries compete), encouraging excessively high savings and keeping interest rates rock bottom to fund heavy spending on roads and ports. China is only now beginning to consider a shift in spending priorities to create social programs that protect its people from the vicissitudes of old age and unemployment.Brazil’s economy is just as badly out of balance, though in opposite ways. While China has introduced reforms relentlessly for three decades, opening itself up to the world even at the risk of domestic instability, Brazil has pushed reforms only in the most dire circumstances, for example, privatizing state companies when the government budget is near collapse. Fearful of foreign shocks, Brazil is still one of the most closed economies in the emerging world - total imports and exports account for only 15 percent of GDP - despite its status as the world's leading exporter of sugar, orange juice, coffee, poultry, and beef.To pay for its big government, Brazil has jacked up taxes and now has a tax burden that equals 38 percent of GDP, the highest in the emerging world, and very similar to the tax burden in developed European welfare states, such as Norway and France. This heavy load of personal and corporate tax on a relatively poor country means that businesses don’t have the money to invest in new technology or training, which in turn means that industry is not getting more efficient. Between 1986 and 2008 Brazil’s productivity grew at an annual rate of :about 0.2 percent, compared to 4 percent in China. Over the same period, productivity grew in India at close to 3 percent and in South Korea and Thailand at close to 2 percent. According to the passage, the major concern facing the Brazil economy is:
....
MCQ-> Directions for the next three questions:Answer the following questions based on the information given below: Telecom operators get revenue from transfer of data and voice. Average revenue received from transfer of each unit of data is known as ARDT. In the diagram below, the revenue received form data transfer as percentage of total revenue received and the ARDT in US Dollars (USD) are given for various countries.The X axis represents the ARDT values and the Y axis represents the % of revenue from data transfer as a percentage of the total revenue.
It was found that the volume of data transfer in India is the same as that of Singapore. Then which of the following statements is true?
....
×
×
Type The Issue
×
Your Marks
Terms And Service:We do not guarantee the accuracy of available data ..We Provide Information On Public Data.. Please consult an expert before using this data for commercial or personal use
Powered By:Omega Web Solutions
© 2002-2017 Omega Education PVT LTD...
Privacy
|
Terms And Conditions
 Powered By:Omega Web Solutions
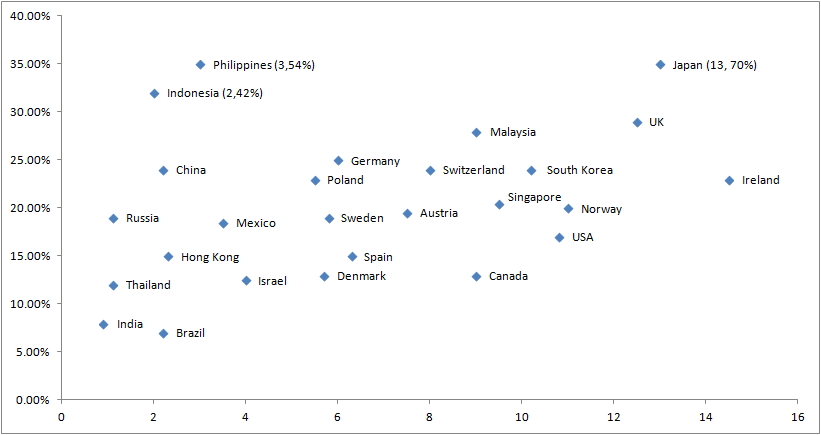 It was found that the volume of data transfer in India is the same as that of Singapore. Then which of the following statements is true?