1. Directions: Study the table carefully to answer the questions that follow:In which months respectively did Manu pay the second highest mobile phone bill and the lowest electricity bill?


Write Comment

Type in
(Press Ctrl+g to toggle between English and the chosen language)

Comments

  • By: anil on 05 May 2019 01.30 am
    Manu paid second highest mobile bill of Rs 345 in March and a lowest electricity bill of Rs 98 in May. Hence the answer is March and May.
Show Similar Question And Answers
QA->WhichBank has launched its own mobile and tab based digital wallet Cippy Wallet appon December 2, 2016 in New Delhi to encourage consumers to experience cash freepurchases from the mobile phone for day-to-day needs.....
QA->A blog written by a mobile device like a mobile phone is called ?....
QA->National Security Adviser of Donald Trump who has resigned amid growing questions about whether he had deceived Vice President Mike Pence, and potentially the FBI, about his phone calls with the Russian envoy on December 29, 2016?....
QA->I'm too busy today, I'll be glad to answer your questions on - - - - - - - occasion. ....
QA->I'm too busy today, I'll be……. to answer your questions on another occasion ....
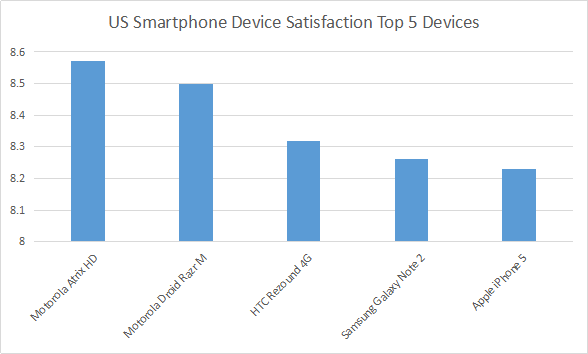
MCQ-> Please read the three reports (newspaper articles) on ranking of different players and products in smart phones industry and answer the questions that follow. Report 1: (Feb, 2013) Apple nabs crown as current top US mobile phone vendor Apple’s reign may not be long, as Samsung is poised to overtake Apple in April, 2013. For the first time since Apple entered the mobile phone market in 2007, it has been ranked the top mobile phone vendor in the US. For the latter quarter of 2012, sales of its iPhone accounted for 34 percent of all mobile phone sales in the US - including feature phones - according to the latest data from Strategy Analytics. While the iPhone has consistently been ranked the top smartphone sold in the US, market research firm NPD noted that feature phone sales have fallen off a cliff recently, to the point where 8 out of every 10 mobile phones sold in the US are now smartphones. That ratio is up considerably from the end of 2011, when smartphones had just cracked the 50 percent mark. Given this fact it’s no surprise that Apple, which only sells smartphones, has been able to reach the top of the overall mobile phone market domestically. For the fourth quarter of 2012, Apple ranked number one with 34 percent of the US mobile market, up from 25.6 percent year over year. Samsung grew similarly, up to 32.3 percent from 26.9 percent - but not enough to keep from slipping to second place. LG dropped to 9 percent from 13.7 percent, holding its third place spot. It should be noted that Samsung and LG both sell a variety of feature phones in addition to smartphones. Looking only at smartphones, the ranking is a little different according to NPD. Apple holds the top spot with 39 percent of the US smartphone market, while Samsung again sits at number two with 30 percent. Motorola manages to rank third with 7 percent, while HTC dropped to fourth with 6 percent. In the US smartphone market, LG is fifth with 6 percent. Note how the percentages aren’t all that different from overall mobile phone market share - for all intents and purposes, the smartphone market is the mobile phone market in the US going forward. Still, Samsung was the top mobile phone vendor overall for 2012, and Strategy Analytics expects Samsung to be back on top soon. “Samsung had been the number one mobile phone vendor in the US since 2008, and it will surely be keen to recapture that title in 2013 by launching improved new models such as the rumored Galaxy S4”. And while Apple is the top vendor overall among smartphones, its iOS platform is still second to the Android platform overall. Samsung is the largest vendor selling Android-based smartphones, but Motorola, HTC, LG, and others also sell Android devices, giving the platform a clear advantage over iOS both domestically and globally. Report 2: Reader’s Response (2013, Feb) I don’t actually believe the numbers for Samsung. Ever since the debacle in early 2011, when Lenovo called into question the numbers Samsung was touting for tablet shipments, stating that Samsung had only sold 20,000 of the 1.5 million tablets they shipped into the US the last quarter of 2010, Samsung (who had no response to Lenovo) has refused to supply quarterly sales numbers for smartphones or tablets. That’s an indication that their sales aren’t what analysts are saying. We can look to several things to help understand why. In the lawsuit between Apple and Samsung here last year, both were required to supply real sales numbers for devices under contention. The phones listed turned out to have sales between one third and one half of what had been guessed by IDC and others. Tablet sales were even worse. Of the 1.5 million tablets supposedly shipped to the US during that time, only 38,000 were sold. Then we have the usage numbers. Samsung tablets have only a 1.5% usage rate, where the iPad has over 90%. Not as much a difference with the phones but it’s still overwhelmingly in favor of iPhone. The problem is that with Apple’s sales, we have actual numbers to go by. The companies who estimate can calibrate what they do after those numbers come out. But with Samsung and many others, they can’t ever calibrate their methods, as there are no confirming numbers released from the firms. A few quarters ago, as a result, we saw iSupply estimate Samsung’s smartphone sales for the quarter at 32 million, with estimates from others all over the place up to 50 million. Each time some other company reported a higher number for that same quarter, the press dutifully used that higher number as THE ONE. But none of them was the one. Without accurate self-reporting of actual sales to the end users, none of these market share charts are worth a damn! Report 3: Contradictory survey (Feb, 2013) iPhone5 Ranks Fifth In U.S. Customer Satisfaction Survey inShare. The iPhone5 ranks fifth in customer satisfaction according to the results of a recent survey from OnDevice Research, a mobile device research group. In the poll, they asked 320,000 smartphone and tablet users from six different countries, how satisfied they were with their devices. According to 93,825 people from the US, Motorola Atrix HD is the most satisfying and Motorola’s Droid Razr took second spot. HTC Corp (TPE : 2498)’s Rezound 4G and Samsung Galaxy Note 2 took third and fourth spots, while Apple’s iPhone5 landed in fifth spot. It appears that Apple may be lagging in consumer interest. OnDevice Research, Sarah Quinn explained, “Although Apple created one of the most revolutionary devices of the past decade, other manufactures have caught up, with some Android powered devices now commanding higher levels of user satisfaction.” Despite the lower rankings, things aren’t looking too bad for Apple Inc. (NASDAQ:AAPL) elsewhere. In the United Kingdom, they ranked second place, right after HTC One X. Interesting enough, Apple did take top spot for overall satisfaction of mobile device, whereas Google Inc. (NASDAQ:GOOG) ranked second. Motorola Mobility Holdings Inc. (NYSE:NOK) took third, fourth, and fifth places respectively, while Sony Ericsson trailed behind at sixth place. The survey sampled mobile device users in the following countries: United States, United Kingdom, France, Germany, Japan, and Indonesia. Although OnDevice didn’t share the full list of devices mentioned in the survey, it does show some insight to what customers want. Unfortunately, there were still many questions regarding the survey that were left unanswered. Everyone wants to know why Google Inc. (NASDAQ:GOOG) was on the list when they are not an actual smartphone maker and why was Samsung Electronics Co., Ltd. (LON:BC94) on the bottom of the satisfaction list when the brand is leading elsewhere. Source: 92.825 US mobile users, July 2012 - January 2013 Fortunately, those questions were answered by OnDevice Research’s representative. He explained that the survey was conducted on mobile web where the survey software could detect the taker’s device and since user’s rate their satisfaction levels on a 1 to 10 scale, thanks to the Nexus device, Google was included.If you analyze the three reports above, which of the following statements would be the best inference?
 ....
MCQ-> Directions: Study the table carefully to answer the questions that follow:In which months respectively did Manu pay the second highest mobile phone bill and the lowest electricity bill?
 ....
MCQ-> DI
 rectI
 ons: I
 n the followI
 ng passage there are blanks, each of whI
 ch has been numbered. These numbers are prI
 nted below the passage and agaI
 nst each, fI
 ve words/ phrases are suggested, one of whI
 ch fI
 ts the blank approprI
 ately. FI
 nd out the approprI
 ate word/ phrase I
 n each case.There I
 s a consI
 derable amount of research about the factors that make a company I
 nnovate. So I
 s I
 t possI
 ble to create an envI
 ronment (I
 ) to I
 nnovatI
 on? ThI
 s I
 s a partI
 cularly pertI
 nent (I
 I
 ) for I
 ndI
 a today. MassI
 ve problems I
 n health, educatI
 on etc (I
 I
 I
 ) be solved usI
 ng a conventI
 onal Approach but (I
 V) creatI
 ve and I
 nnovatI
 ve solutI
 ons that can ensure radI
 cal change and (V). There are several factors I
 n I
 ndI
 a's (VI
 ). Few countrI
 es have the rI
 ch dI
 versI
 ty that I
 ndI
 a or I
 ts large, young populatI
 on (VI
 I
 ). WhI
 le these (VI
 I
 I
 ) I
 nnovatI
 on polI
 cy I
 nterventI
 ons certaI
 n addI
 tI
 onal steps are also requI
 red. These I
 nclude (I
 X) I
 nvestment I
 n research and development by (X) the government and the prI
 vate sector, easy transfer of technology from the academI
 c world etc. To fulfI
 ll I
 ts promI
 se of beI
 ng prosperous and to be at the forefront, I
 ndI
 a must be I
 nnovatI
 ve.I
 ....
MCQ-> Study the information given below and answer the questions.The following table contains the pre and post revision pay structure of a Government departmentThe revision has been done based on the following terms: -In pre-revised pay scale, the basic pay is the sum of the minimum pay in the appropriate pay scale and the admissible increment. After revision, the basic pay is the sum of minimum pay in the appropriate pay scale and the respective grade pay and the admissible increments. -Annual increment of 3% of the basic pay (on a compounded basic) is paid under the revised pay rules. -Monthly Dearness Allowance (DA) is calculated as percentage of basic pay. -In pre-revised pay scales, the increment was given after the completion of each year of service, but, after revision annual increments are given only in the month of July every year and there should be a gap of six months between the increments. The employees who had joined the department in the month of September, October, November and December are given an increment at the time of revised pay fixation in September, 2008. The revised pay is applicable from 1st September, 2008.Abhijit joins the department on November 10, 2006 in the pay scale of Rs. 18,400-500-22,400 with the pay of Rs. 18,400 plus 2 increments. What is his basic salary, after revision, on August 1, 2009?
 ....
MCQ-> Governments looking for easy popularity have frequently been tempted into announcing give­a­ways of all sorts; free electricity, virtually free water, subsidized food, cloth at half price, and so on. The subsidy culture has gone to extremes. The richest farmers in the country get subsidized fertilizers. University education, typically accessed by the wealthier sections, is charged at a fraction of cost. Postal services are subsidized, and so are railway services. Bus fares cannot be raised to economical levels because there will be violent protest, so bus travel is subsidized too. In the past, price control on a variety of items, from steel to cement, meant that industrial consumer of these items got them at less than actual cost, while the losses of the public sector companies that produced them were borne by the taxpayer! A study done a few years ago, came to the conclusion that subsidies in the Indian economy total as much as 14.5 per cent of gross domestic product. At today's level, that would work out to about 1,50,000 crore. And who pay the bill? The theory­and the Political fiction on the basis of I which it is sold to unsuspecting voters­is that subsidies go the poor. and are paid for by the rich. The fact is that most subsidies go the 'rich' (defined in the Indian context as those who are above the poverty line), and much of the tab goes indirectly to the poor. Because the hefty subsidy bill results in fiscal deficits, which in turn push up rates of inflation­which, as everyone knows, hits the poor the hardest of all. That is why taxmen call inflation the most regressive form of taxation. The entire subsidy system is built on the thesis that people cannot help themselves, therefore governments must do so. That people cannot afford to pay for variety of goods and services, and therefore the government must step in. This thesis has been applied not just in the poor countries but in the rich ones as well; hence the birth of the welfare state in the west, and an almost Utopian social security system; free medical care, food aid, old age security, et.al. But with the passage of time, most of the wealthy nations have discovered that their economies cannot sustain this social safety net, which in fact reduces the desire among people to pay their own way, and takes away some of the incentive to work, in short, the bill was unaffordable, and their societies were simply not willing to pay. To the regret of many, but because of the laws of economies are harsh, most Western societies have been busy pruning the welfare bill. In India, the lessons of this experience over several decades, and in many countries­do not seem to have been learnt. Or they are simply ignored in the pursuit of immediate votes. People who are promised cheap food or clothing do not in most cases look beyond the gift horses­to the question of who picks up the tab. The uproar over higher petrol, diesel and cooking gas prices ignored this basic question; if the user of cooking gas does not want to pay for its cost, who should pay? Diesel in the country is subsidised, and if the user of cooking gas does not want to pay for its full cost, who does he or she think should pay the balance of the cost? It is a simple question, nevertheless if remains unasked. The Deva Gowda government has shown some courage in biting the bullet when it comes to the price of petroleum products. But it has been bitten by much bigger subsidy bug. It wants to offer food at half its cost to everyone below the poverty line, supposedly estimated at some 380 million people. What will be the cost? And of course, who will pick up the tab? The Andhra Pradesh Government has been bankrupted by selling rice as 2 per kg. Should the Central Government be bankrupted too, before facing up to the question of what is affordable and what is not? Already, India is perennially short of power because the subsidy on electricity has bankrupted most electricity boards, and made private investment wary unless it gets all manner of state guarantees. Delhi's subsidised bus fares have bankrupted the Delhi Transport Corporation, whose buses have slowly disappeared from the capital's streets. It is easy to be soft and sentimental, by looking at programmes that will be popular. After all, who does not like a free lunch? But the evidence is surely mounting that the lunch isn't free at all. Somebody is paying the bill. And if you want to know who, take at the country's poor economic performance over the years. Which of the following should not be subsidised over the years ?
 ....
Terms And Service:We do not guarantee the accuracy of available data ..We Provide Information On Public Data.. Please consult an expert before using this data for commercial or personal use
DMCA.com Protection Status Powered By:Omega Web Solutions
© 2002-2017 Omega Education PVT LTD...Privacy | Terms And Conditions