Toggle navigation
Home
Article Category
Question Papers
General Knowlege
Popular Pages
Multiple Choice Question in 049
Multiple Choice Question in
Multiple Choice Question in TRADES-INSTRUCTOR---GR-II---SMITHY---TECHNICAL-EDUCATION
Multiple Choice Question in -current-affairs-2016
Question Answer in ASSISTANT-PROFESSOR---COMPUTER-SCIENCE-AND-ENGINEERING---TECHNICAL-EDUCATION
Multiple Choice Question in ASSISTANT-PROFESSOR---COMPUTER-SCIENCE-AND-ENGINEERING---TECHNICAL-EDUCATION
Multiple Choice Question in english
Multiple Choice Question in abbreviations-abbreviations-m
Multiple Choice Question in 2016
Multiple Choice Question in SSC CHSL 7 March 2018 Morning Shift
Multiple Choice Question in 072/2016
Question Answer Bank
Multiple Choice Question Bank
Question Answer Category
Multiple Choice Question Category
Home
->
Question Answer Bank
1. WHAT IS INDIA'S RANK IN THE 2016 GLOBAL PEACE INDEX
Answer: 141
Previous Question
Next Question
Add Tags
Report Error
Reply
Type in
(Press Ctrl+g to toggle between English and the chosen language)
Post reply
Comments
Tags
Show Similar Question And Answers
QA->WHAT IS INDIA'S RANK IN THE 2016 GLOBAL PEACE INDEX....
QA->What isthe India’s rank in the 2016 Global Peace Index (GPI)?....
QA->What isthe rank of India in the Global Terrorism Index (GTI),2016?....
QA->What isthe India’s rank in the 2016 Global Slavery Index?....
QA->What isthe India’s rank in the 2017 Global Innovation Index (GII)?....
MCQ-> Read the following passage carefully and answer the questions given at the end. The second issue I want to address is one that comes up frequently - that Indian banks should aim to become global. Most people who put forward this view have not thought through the costs and benefits analytically; they only see this as an aspiration consistent with India’s growing international profile. In its 1998 report, the Narasimham (II) Committee envisaged a three tier structure for the Indian banking sector: 3 or 4 large banks having an international presence on the top, 8-10 mid-sized banks, with a network of branches throughout the country and engaged in universal banking, in the middle, and local banks and regional rural banks operating in smaller regions forming the bottom layer. However, the Indian banking system has not consolidated in the manner envisioned by the Narasimham Committee. The current structure is that India has 81 scheduled commercial banks of which 26 are public sector banks, 21 are private sector banks and 34 are foreign banks. Even a quick review would reveal that there is no segmentation in the banking structure along the lines of Narasimham II.A natural sequel to this issue of the envisaged structure of the Indian banking system is the Reserve Bank’s position on bank consolidation. Our view on bank consolidation is that the process should be market-driven, based on profitability considerations and brought about through a process of mergers & amalgamations (M&As;). The initiative for this has to come from the boards of the banks concerned which have to make a decision based on a judgment of the synergies involved in the business models and the compatibility of the business cultures. The Reserve Bank’s role in the reorganisation of the banking system will normally be only that of a facilitator.lt should be noted though that bank consolidation through mergers is not always a totally benign option. On the positive side are a higher exposure threshold, international acceptance and recognition, improved risk management and improvement in financials due to economies of scale and scope. This can be achieved both through organic and inorganic growth. On the negative side, experience shows that consolidation would fail if there are no synergies in the business models and there is no compatibility in the business cultures and technology platforms of the merging banks.Having given that broad brush position on bank consolidation let me address two specific questions: (i) can Indian banks aspire to global size?; and (ii) should Indian banks aspire to global size? On the first question, as per the current global league tables based on the size of assets, our largest bank, the State Bank of India (SBI), together with its subsidiaries, comes in at No.74 followed by ICICI Bank at No. I45 and Bank of Baroda at 188. It is, therefore, unlikely that any of our banks will jump into the top ten of the global league even after reasonable consolidation.Then comes the next question of whether Indian banks should become global. Opinion on this is divided. Those who argue that we must go global contend that the issue is not so much the size of our banks in global rankings but of Indian banks having a strong enough, global presence. The main argument is that the increasing global size and influence of Indian corporates warrant a corresponding increase in the global footprint of Indian banks. The opposing view is that Indian banks should look inwards rather than outwards, focus their efforts on financial deepening at home rather than aspiring to global size.It is possible to take a middle path and argue that looking outwards towards increased global presence and looking inwards towards deeper financial penetration are not mutually exclusive; it should be possible to aim for both. With the onset of the global financial crisis, there has definitely been a pause to the rapid expansion overseas of our banks. Nevertheless, notwithstanding the risks involved, it will be opportune for some of our larger banks to be looking out for opportunities for consolidation both organically and inorganically. They should look out more actively in regions which hold out a promise of attractive acquisitions.The surmise, therefore, is that Indian banks should increase their global footprint opportunistically even if they do not get to the top of the league table.Identify the correct statement from the following:
...
MCQ-> Read the following passage to answer the given questions based on it. Some words/ phrases are printed in bold to help you locate them while answering some of the questions. India’s manufacturing growth fell to its lowest in more than two years in September, 2011,
reinforcing
fears that an extended period of high policy rates is hurting growth, according to a closely watched index. The HSBC India Purchasing Managers’ Index (PMI), based on a survey of over 500 companies, fell to 50.4 from 52.6 in August and 53.6 in July. It was the lowest since March 2009. when the reading was below 50. indicating contraction. September’s index also recorded the biggest one-month fall since November 2008. The sub index for new orders. which reflects future output, declined for the sixtli successive month, while xport orders full for it Liar(‘ month on the back of weakness in global economy. The Reserve Bank of India (RBI) last week indicated
it was not done yet
with monetary policy tightening as inflation was still high. The bank has already raised rates 12 times since March 2010 to
tame
inflation, which is at a 13-month high of 9.78%. Economists expect the RBI to raise rates one more time but warn that targeted growth will be hard to achieve if the
slump
continues. “This• (fall in PMI) was driven by weaker orders. with export orders still contracting due to the weaker global economic conditions.- HSBC said in a press release quoting its chief economist for India &ASEAN.; PMI is considered a fairly good indicator of manufacturing activity the world over. but in case of India, the large contribution of the unorganised sector
yields
a low correlation with industrial growth. However, the Index for Industrial Production (IIP) has been showing a weakening trend. having slipped to a 21- month low of 3.3 % in July. The core sector. which consists of eight infrastructure industries and has a combined weight of 37.9% in the IIP. also grew at only 3.5% in August. The PMI data is in line with the suffering manufacturing activity in India as per other estimates. Producers are seeing that demand conditions are softening and the outlook is uncertain, therefore they are producing less. Employment in the manufacturing sector declined for the second consecutive month, indicating it too was under pressure. This could be attributed to lower requirement of staff and rise in resignations as higher wage requests go unfulfilled, the HSBC statement said. On the inflation front, input prices rose at an 11 -month low rate, but despite signs of softening, they
still
remain at historically high levels. While decelerating slightly, the readings for input and output prices suggest that inflation pressures remain firmly in place. Most economists feel the RBI is close to the end of its rate hike cycle. Even the weekly Wholesale Price Index (WPI) estimates have started showing signs of softening. Having fallen more than one percentage point.The PMI is based on surveys of
...
MCQ-> The first table gives the number of saris (of all the eight colours) stocked in six regional showrooms. The second gives the number of saris (of all the eight colours) sold in these six regional showrooms. The third table gives the percentage of saris sold to saris stocked for each colour in each region. The fourth table gives the percentage of saris of a specific colour sold within that region. The fifth table gives the percentage of saris of a specific colour sold across all the regions. Study the tables and for each of the following questions, choose the best alternative.Table 1
Table 2
Table 3
Table 4
Table 5
Which region-colour combination accounts for the highest percentage of sales to stock?
...
MCQ-> Directions for the following four questions:Each question is followed by two statements, A and B. Answer each question using the following instructions:Five students Atul, Bala, Chetan, Dev and Ernesto were the only ones who participated in a quiz contest. They were ranked based on their scores in the contest. Dev got a higher rank as compared to Ernesto, while Bala got a higher rank as compared to Chetan. Chetan’s rank was lower than the median. Who among the five got the highest rank?A. Atul was the last rank holder.B. Bala was not among the top two rank holders.
...
MCQ-> The broad scientific understanding today is that our planet is experiencing a warming trend over and above natural and normal variations that is almost certainly due to human activities associated with large-scale manufacturing. The process began in the late 1700s with the Industrial Revolution, when manual labor, horsepower, and water power began to be replaced by or enhanced by machines. This revolution, over time, shifted Britain, Europe, and eventually North America from largely agricultural and trading societies to manufacturing ones, relying on machinery and engines rather than tools and animals.The Industrial Revolution was at heart a revolution in the use of energy and power. Its beginning is usually dated to the advent of the steam engine, which was based on the conversion of chemical energy in wood or coal to thermal energy and then to mechanical work primarily the powering of industrial machinery and steam locomotives. Coal eventually supplanted wood because, pound for pound, coal contains twice as much energy as wood (measured in BTUs, or British thermal units, per pound) and because its use helped to save what was left of the world's temperate forests. Coal was used to produce heat that went directly into industrial processes, including metallurgy, and to warm buildings, as well as to power steam engines. When crude oil came along in the mid- 1800s, still a couple of decades before electricity, it was burned, in the form of kerosene, in lamps to make light replacing whale oil. It was also used to provide heat for buildings and in manufacturing processes, and as a fuel for engines used in industry and propulsion.In short, one can say that the main forms in which humans need and use energy are for light, heat, mechanical work and motive power, and electricity which can be used to provide any of the other three, as well as to do things that none of those three can do, such as electronic communications and information processing. Since the Industrial Revolution, all these energy functions have been powered primarily, but not exclusively, by fossil fuels that emit carbon dioxide (CO2), To put it another way, the Industrial Revolution gave a whole new prominence to what Rochelle Lefkowitz, president of Pro-Media Communications and an energy buff, calls "fuels from hell" - coal, oil, and natural gas. All these fuels from hell come from underground, are exhaustible, and emit CO2 and other pollutants when they are burned for transportation, heating, and industrial use. These fuels are in contrast to what Lefkowitz calls "fuels from heaven" -wind, hydroelectric, tidal, biomass, and solar power. These all come from above ground, are endlessly renewable, and produce no harmful emissions.Meanwhile, industrialization promoted urbanization, and urbanization eventually gave birth to suburbanization. This trend, which was repeated across America, nurtured the development of the American car culture, the building of a national highway system, and a mushrooming of suburbs around American cities, which rewove the fabric of American life. Many other developed and developing countries followed the American model, with all its upsides and downsides. The result is that today we have suburbs and ribbons of highways that run in, out, and around not only America s major cities, but China's, India's, and South America's as well. And as these urban areas attract more people, the sprawl extends in every direction.All the coal, oil, and natural gas inputs for this new economic model seemed relatively cheap, relatively inexhaustible, and relatively harmless-or at least relatively easy to clean up afterward. So there wasn't much to stop the juggernaut of more people and more development and more concrete and more buildings and more cars and more coal, oil, and gas needed to build and power them. Summing it all up, Andy Karsner, the Department of Energy's assistant secretary for energy efficiency and renewable energy, once said to me: "We built a really inefficient environment with the greatest efficiency ever known to man."Beginning in the second half of the twentieth century, a scientific understanding began to emerge that an excessive accumulation of largely invisible pollutants-called greenhouse gases - was affecting the climate. The buildup of these greenhouse gases had been under way since the start of the Industrial Revolution in a place we could not see and in a form we could not touch or smell. These greenhouse gases, primarily carbon dioxide emitted from human industrial, residential, and transportation sources, were not piling up along roadsides or in rivers, in cans or empty bottles, but, rather, above our heads, in the earth's atmosphere. If the earth's atmosphere was like a blanket that helped to regulate the planet's temperature, the CO2 buildup was having the effect of thickening that blanket and making the globe warmer.Those bags of CO2 from our cars float up and stay in the atmosphere, along with bags of CO2 from power plants burning coal, oil, and gas, and bags of CO2 released from the burning and clearing of forests, which releases all the carbon stored in trees, plants, and soil. In fact, many people don't realize that deforestation in places like Indonesia and Brazil is responsible for more CO2 than all the world's cars, trucks, planes, ships, and trains combined - that is, about 20 percent of all global emissions. And when we're not tossing bags of carbon dioxide into the atmosphere, we're throwing up other greenhouse gases, like methane (CH4) released from rice farming, petroleum drilling, coal mining, animal defecation, solid waste landfill sites, and yes, even from cattle belching. Cattle belching? That's right-the striking thing about greenhouse gases is the diversity of sources that emit them. A herd of cattle belching can be worse than a highway full of Hummers. Livestock gas is very high in methane, which, like CO2, is colorless and odorless. And like CO2, methane is one of those greenhouse gases that, once released into the atmosphere, also absorb heat radiating from the earth's surface. "Molecule for molecule, methane's heat-trapping power in the atmosphere is twenty-one times stronger than carbon dioxide, the most abundant greenhouse gas.." reported Science World (January 21, 2002). “With 1.3 billion cows belching almost constantly around the world (100 million in the United States alone), it's no surprise that methane released by livestock is one of the chief global sources of the gas, according to the U.S. Environmental Protection Agency ... 'It's part of their normal digestion process,' says Tom Wirth of the EPA. 'When they chew their cud, they regurgitate [spit up] some food to rechew it, and all this gas comes out.' The average cow expels 600 liters of methane a day, climate researchers report." What is the precise scientific relationship between these expanded greenhouse gas emissions and global warming? Experts at the Pew Center on Climate Change offer a handy summary in their report "Climate Change 101. " Global average temperatures, notes the Pew study, "have experienced natural shifts throughout human history. For example; the climate of the Northern Hemisphere varied from a relatively warm period between the eleventh and fifteenth centuries to a period of cooler temperatures between the seventeenth century and the middle of the nineteenth century. However, scientists studying the rapid rise in global temperatures during the late twentieth century say that natural variability cannot account for what is happening now." The new factor is the human factor-our vastly increased emissions of carbon dioxide and other greenhouse gases from the burning of fossil fuels such as coal and oil as well as from deforestation, large-scale cattle-grazing, agriculture, and industrialization.“Scientists refer to what has been happening in the earth’s atmosphere over the past century as the ‘enhanced greenhouse effect’”, notes the Pew study. By pumping man- made greenhouse gases into the atmosphere, humans are altering the process by which naturally occurring greenhouse gases, because of their unique molecular structure, trap the sun’s heat near the earth’s surface before that heat radiates back into space."The greenhouse effect keeps the earth warm and habitable; without it, the earth's surface would be about 60 degrees Fahrenheit colder on average. Since the average temperature of the earth is about 45 degrees Fahrenheit, the natural greenhouse effect is clearly a good thing. But the enhanced greenhouse effect means even more of the sun's heat is trapped, causing global temperatures to rise. Among the many scientific studies providing clear evidence that an enhanced greenhouse effect is under way was a 2005 report from NASA's Goddard Institute for Space Studies. Using satellites, data from buoys, and computer models to study the earth's oceans, scientists concluded that more energy is being absorbed from the sun than is emitted back to space, throwing the earth's energy out of balance and warming the globe."Which of the following statements is correct? (I) Greenhouse gases are responsible for global warming. They should be eliminated to save the planet (II) CO2 is the most dangerous of the greenhouse gases. Reduction in the release of CO2 would surely bring down the temperature (III) The greenhouse effect could be traced back to the industrial revolution. But the current development and the patterns of life have enhanced their emissions (IV) Deforestation has been one of the biggest factors contributing to the emission of greenhouse gases Choose the correct option:...
×
×
Type The Issue
Terms And Service:We do not guarantee the accuracy of available data ..We Provide Information On Public Data.. Please consult an expert before using this data for commercial or personal use
Powered By:Omega Web Solutions
© 2002-2017 Omega Education PVT LTD...
Privacy
|
Terms And Conditions
 Powered By:Omega Web Solutions
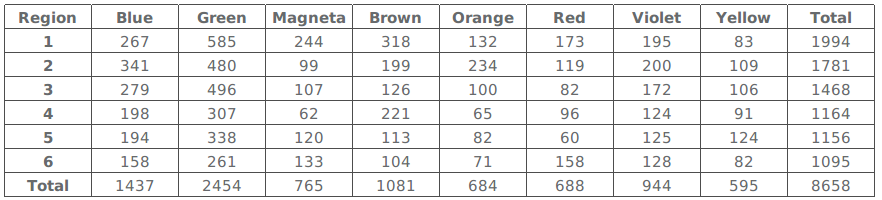 Table 2
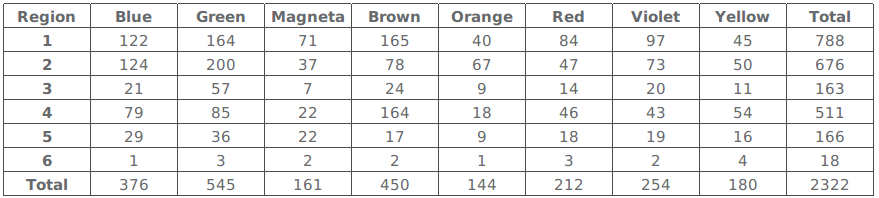 Table 3
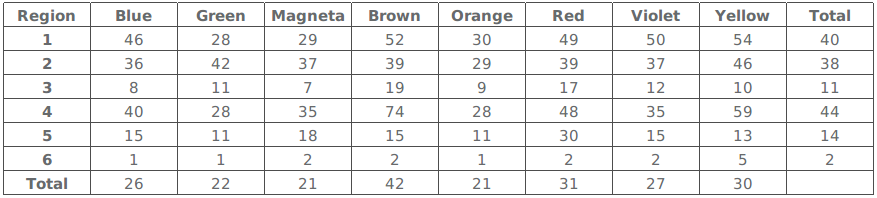 Table 4
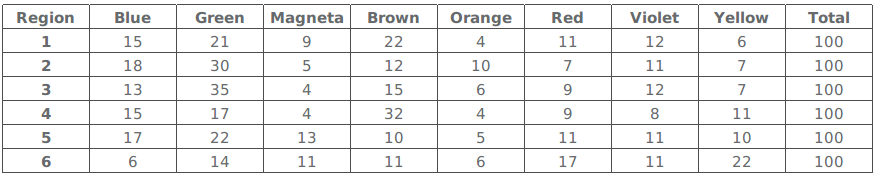 Table 5
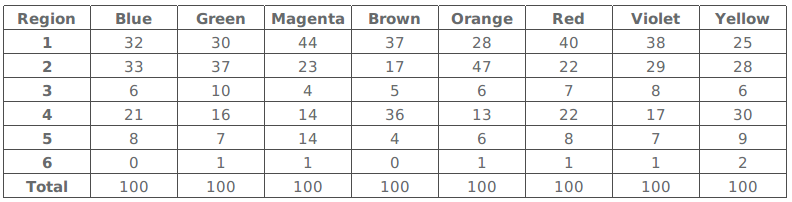 Which region-colour combination accounts for the highest percentage of sales to stock?