Toggle navigation
Home
Article Category
Question Papers
General Knowlege
Popular Pages
Multiple Choice Question in 049
Multiple Choice Question in
Multiple Choice Question in TRADES-INSTRUCTOR---GR-II---SMITHY---TECHNICAL-EDUCATION
Multiple Choice Question in -current-affairs-2016
Question Answer in ASSISTANT-PROFESSOR---COMPUTER-SCIENCE-AND-ENGINEERING---TECHNICAL-EDUCATION
Multiple Choice Question in ASSISTANT-PROFESSOR---COMPUTER-SCIENCE-AND-ENGINEERING---TECHNICAL-EDUCATION
Multiple Choice Question in english
Multiple Choice Question in 2016
Multiple Choice Question in abbreviations-abbreviations-m
Multiple Choice Question in SSC CHSL 7 March 2018 Morning Shift
Multiple Choice Question in 072/2016
Question Answer Bank
Multiple Choice Question Bank
Question Answer Category
Multiple Choice Question Category
Home
->
Question Answer Bank
1. The slope of the displacement time graph gives us the :
Answer: Velocity
Previous Question
Next Question
Add Tags
Report Error
Reply
Type in
(Press Ctrl+g to toggle between English and the chosen language)
Post reply
Comments
Tags
Show Similar Question And Answers
QA->The slope of the displacement time graph gives us the :....
QA->Engine lubricating oil pumps are usually positive displacement types because they are suitable for?....
QA->The lines having equal gradient along a slope are called:....
QA->Hypotenuses allowance to be applied to each 20 m chain length along a slope φ degree is :....
QA->Which cold and dense air blowing down the mountain slope during the night?....
MCQ->
Five sentences related to a topic are given below. Four of them can be put together to form a meaningful and coherent short paragraph. Identify the odd one out.
1) Displacement in Bengal is thus not very significant in view of its magnitude.2) A factor of displacement in Bengal is the shifting course of the Ganges leading to erosion of river banks.3) The nature of displacement in Bengal makes it an interesting case study.4) Since displacement due to erosion is well spread over a long period of time, it remains invisible.5) Rapid displacement would have helped sensitize the public to its human costs....
MCQ->A graph may be defined as a set of points connected by lines called edges. Every edge connects a pair of points. Thus, a triangle is a graph with 3 edges and 3 points. The degree of a point is the number of edges connected to it. For example, a triangle is a graph with three points of degree 2 each. Consider a graph with 12 points. It is possible to reach any point from any point through a sequence of edges. The number of edges, e, in the graph must satisfy the condition...
MCQ-> The first table gives the number of saris (of all the eight colours) stocked in six regional showrooms. The second gives the number of saris (of all the eight colours) sold in these six regional showrooms. The third table gives the percentage of saris sold to saris stocked for each colour in each region. The fourth table gives the percentage of saris of a specific colour sold within that region. The fifth table gives the percentage of saris of a specific colour sold across all the regions. Study the tables and for each of the following questions, choose the best alternative.Table 1
Table 2
Table 3
Table 4
Table 5
Which region-colour combination accounts for the highest percentage of sales to stock?
...
MCQ-> Study the graph below and answer the questions that follow: This graph depicts the last eight years’ annual salaries (in Rs. lacs.) offered to student during campus placement. Every year 100 students go through placement process. However, at least one of them fails to get placed. The salaries of all unplaced students are marked zero and represented in the graph.
The bold line in the graph presents Mean salaries at various years.In which year were a maximum number of students offered salaries between Rs. 20 to Rs.30 lacs(both inclusive)?
...
MCQ-> Read the following information, graph and table and answer the questions that follow. Ellen Inc. is a Mumbai based company which sells five products branded as A, B, C, D and E in India. Anita looks after entire sales of North India working from regional office in Delhi. She was preparing for annual review meeting scheduled next day in Mumbai. She was attempting to analyse sales in North India for the seven year period from 2009 to 2015. She first calculated average sales in rupees of all the five brands and constructed a table exhibiting the difference between average sales of each pair of brands as shown in the following table:
Average Sales of Product A minus Average Sales of Product B After taking a print out of the above table, she attempted to look at the trend of sales and plotted a graph in MS Excel. Later she took a print out of the graph and left for a meeting. While on her way she figured out that due to some printer cartridge problem sales of Product A in 2013, Product C in 2010, and Product D in 2012 were not visible in the graph as reproduced below. Anita had to make some quick calculations to arrive at the information outlined in the following question.
What are the sales of Product A in 2013, Product C in 2010 and Product D in 2012?
...
×
×
Type The Issue
Terms And Service:We do not guarantee the accuracy of available data ..We Provide Information On Public Data.. Please consult an expert before using this data for commercial or personal use
Powered By:Omega Web Solutions
© 2002-2017 Omega Education PVT LTD...
Privacy
|
Terms And Conditions
 Powered By:Omega Web Solutions
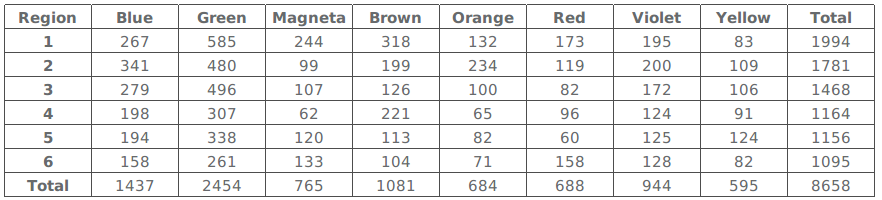 Table 2
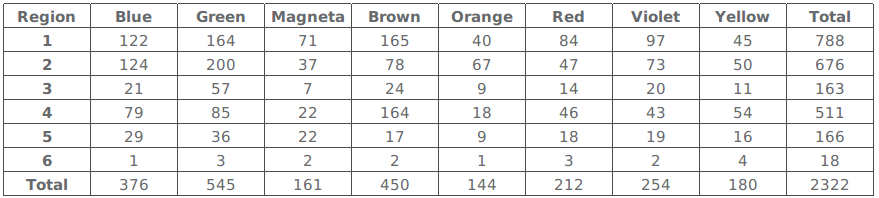 Table 3
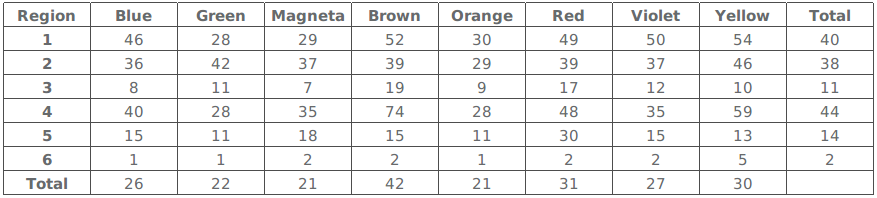 Table 4
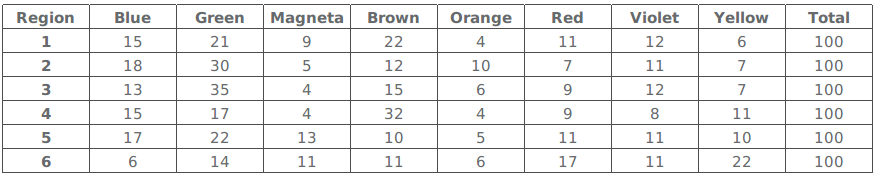 Table 5
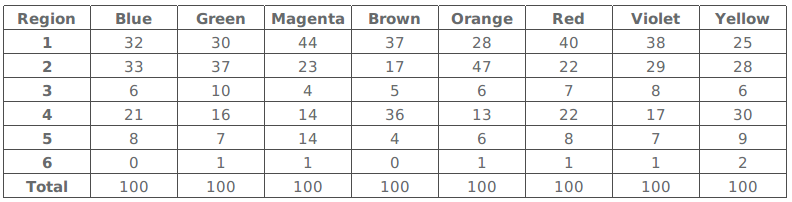 Which region-colour combination accounts for the highest percentage of sales to stock?
 The bold line in the graph presents Mean salaries at various years.In which year were a maximum number of students offered salaries between Rs. 20 to Rs.30 lacs(both inclusive)?
 Average Sales of Product A minus Average Sales of Product B
After taking a print out of the above table, she attempted to look at the trend of sales and plotted a graph in MS Excel. Later she took a print out of the graph and left for a meeting. While on her way she figured out that due to some printer cartridge problem sales of Product A in 2013, Product C in 2010, and Product D in 2012 were not visible in the graph as reproduced below. Anita had to make some quick calculations to arrive at the information outlined in the following question.
Average Sales of Product A minus Average Sales of Product B
After taking a print out of the above table, she attempted to look at the trend of sales and plotted a graph in MS Excel. Later she took a print out of the graph and left for a meeting. While on her way she figured out that due to some printer cartridge problem sales of Product A in 2013, Product C in 2010, and Product D in 2012 were not visible in the graph as reproduced below. Anita had to make some quick calculations to arrive at the information outlined in the following question.
 What are the sales of Product A in 2013, Product C in 2010 and Product D in 2012?