1. Olympians who have been picked for the 2012 G.V. Raja award — .the highest sporting honour of the State instituted by the Kerala State Sports Council?

Answer: V. Diju (badminton) and Tintu Luka (athletics).

Reply

Type in
(Press Ctrl+g to toggle between English and the chosen language)

Comments

Tags
Show Similar Question And Answers
QA->Olympians who have been picked for the 2012 G.V. Raja award — .the highest sporting honour of the State instituted by the Kerala State Sports Council?....
QA->Who has been selected for “Ezhuthachan Puraskaram 2011”, the highest literary honour instituted by the government of Kerala?....
QA->Travancore-Cochin Sports Council came to be known as Kerala Sports Council in?....
QA->Legendary hockey player and one of India’s greatest Olympians who passed away on 20 December 2012?....
QA->Which noted Indian artist was conferred with the highest French civilian honour, the Commandeur de la Legion d’Honneur (the Legion of Honour)?....
MCQ-> DIRECTIONS for questions:These questions are based on the situation given below:Recently, Ghosh Babu spent his winter vacation on Kyakya Island. During the vacation, he visited the local casino where he came across a new card game. Two players, using a normal deck of 52 playing cards, play this game. One player is called the Dealer and the other is called the Player. First, the Player picks a card at random from the deck. This is called the base card. The amount in rupees equal to the face value of the base card is called the base amount. The face values of Ace, King, Queen and Jack are ten. For other cards, the face value is the number on the card. Once, the Player picks a card from the deck, the Dealer pays him the base amount. Then the dealer picks a card from the deck and this card is called the top card. If the top card is of the same suit as the base card, the Player pays twice the base amount to the Dealer. If the top card is of the same colour as the base card (but not the same suit) then the Player pays the base amount to the Dealer. If the top card happens to be of a different colour than the base card, the Dealer pays the base amount to the Player. Ghosh Babu played the game 4 times. First time he picked eight of clubs and the Dealer picked queen of clubs. Second time, he picked ten of hearts and the dealer picked two of spades. Next time, Ghosh Babu picked six of diamonds and the dealer picked ace of hearts. Lastly, he picked eight of spades and the dealer picked jack of spades. Answer the following questions based on these four games.If Ghosh Babu stopped playing the game when his gain would be maximized, the gain in Rs. would have been
 ...
MCQ-> Directions: Read the following passage carefully and answer the questions given below it. Certain words/phrases have been printed in bold to help you locate them while answering some of the questions. When times are hard, doomsayers are aplenty. The problem is that if you listen to them too carefully, you tend to overlook the most obvious signs of change. 2011 was a bad year. Can 2012 be any worse? Doomsday forecasts are the easiest to make these days. So let's try a contrarian's forecast instead. Let's start with the global economy. We have seen a steady flow of good news from the US. The employment situation seems to be improving rapidly and consumer sentiment, reflected in retail expenditures on discretionary items like electronics and clothes, has picked up. If these trends sustain, the US might post better growth numbers for 2012 than the 1.5 - 1.8 percent being forecast currently. Japan is likely to pull out of a recession in 2012 as post-earthquake reconstruction efforts gather momentum and the fiscal stimulus announced in 2011 begin to pay off. The consensus estimate for growth in Japan is a respectable 2 percent for 2012. The "hard landing' scenario for China remains and will remain a myth. Growth might decelerate further from the 9 percent that is expected to clock in 2011 but is unlikely to drop below 8 - 8.5 percent in 2012. Europe is certainly in a spot of trouble. It is perhaps already in recession and for 2012 it is likely to post mildly negative growth. The risk of implosion has dwindled over the last few months- peripheral economies like Greece, Italy and Spain have new governments in place and have made progress towards genuine economic reform. Even with some these positive factors in place, we have to accept the fact that global growth in 2012 will be tepid. But there is a flipside to this. Softer growth means lower demand for commodities, and this is likely to drive a correction in commodity prices. Lower commodity inflation will enable emerging market central banks to reverse their monetary stance. China, for instance, has already reversed its stance and have pared its reserve ratio twice. The RBI also seems poised for a reversal in its rate cycle as headline inflation seems well one its way to its target of 7 percent for March 2012. That said, oil might be an exception to the general trend in commodities. Rising geopolitical tensions, particularly the continuing face-off between Iran and the US, might lead to a spurt in prices. It might make sense for our oil companies to hedge this risk instead of buying oil in the spot market. As inflation fears abate, and emerging market central banks begin to cut rates, two things could happen. Lower commodity inflation would mean lower interest rates and better credit availability. This could set the floor to growth and slowly reverse the business cycle within these economies. Second, as the fear of untamed, runaway inflation in these economies abates, the global investor's comfort levels with their markets will increase. Which of the emerging markets will outperform and who will leave behind? In an environment in which global growth is likely to be weak, economies like India that have a powerful domestic consumption dynamic should lead; those dependent on exports should, prima facie, fall behind. Specifically for India, a fall in the exchange rate could not have come at a better time. It will help Indian exporters gain market share even if global trade remains depressed. More importantly, it could lead to massive import substitution that favours domestic producers.Let’s now focus on India and start with a caveat. It is important not to confuse a short run cyclical dip with a permanent derating of its long-term structural potential. The arithmetic is simple. Our growth rate can be in the range of 7-10 percent depending on policy action. Ten percent if we get everything right, 7 percent if we get it all wrong. Which policies and reforms are critical to taking us to our 10 percent potential? In judging this, let’s again be careful. Let’s not go by the laundry list of reforms that FIIs like to wave: The increase in foreign equity limits in foreign shareholding, greater voting rights for institutional shareholders in banks, FDI in retail, etc. These can have an impact only at the margin. We need not bend over backwards to appease the FIIs through these reforms they will invest in our markets when momentum picks up and will be the first to exit when the momentum flags, reforms or not. The reforms that we need are the ones that can actually raise our sustainable longterm growth rate. These have to come in areas like better targeting of subsidies, making projects in infrastructure viable so that they draw capital, raising the productivity of agriculture, improving healthcare and education, bringing the parallel economy under the tax net, implementing fundamental reforms in taxation like GST and the direct tax code and finally easing the myriad rules and regulations that make doing business in India such a nightmare. A number of these things do not require new legislation and can be done through executive order.Which of the following is not true according to the passage?
 ...
MCQ-> Directions : Choose the word/group of words which is most opposite in meaning to the word / group of words printed in bold as used in the passage.When times are hard, doomsayers are aplenty. The problem is that if you listen to them too carefully, you tend to overlook the most obvious signs of change. 2011 was a bad year. Can 2012 be any worse? Doomsday forecasts are the easiest to make these days. So let's try a contrarian's forecast instead. Let's start with the global economy. We have seen a steady flow of good news from the US. The employment situation seems to be improving rapidly and consumer sentiment, reflected in retail expenditures on discretionary items like electronics and clothes, has picked up. If these trends sustain, the US might post better growth numbers for 2012 than the 1.5 - 1.8 percent being forecast currently. Japan is likely to pull out of a recession in 2012 as post-earthquake reconstruction efforts gather momentum and the fiscal stimulus announced in 2011 begin to pay off. The consensus estimate for growth in Japan is a respectable 2 percent for 2012. The "hard landing' scenario for China remains and will remain a myth. Growth might decelerate further from the 9 percent that is expected to clock in 2011 but is unlikely to drop below 8 - 8.5 percent in 2012. Europe is certainly in a spot of trouble. It is perhaps already in recession and for 2012 it is likely to post mildly negative growth. The risk of implosion has dwindled over the last few months- peripheral economies like Greece, Italy and Spain have new governments in place and have made progress towards genuine economic reform. Even with some these positive factors in place, we have to accept the fact that global growth in 2012 will be tepid. But there is a flipside to this. Softer growth means lower demand for commodities, and this is likely to drive a correction in commodity prices. Lower commodity inflation will enable emerging market central banks to reverse their monetary stance. China, for instance, has already reversed its stance and have pared its reserve ratio twice. The RBI also seems poised for a reversal in its rate cycle as headline inflation seems well one its way to its target of 7 percent for March 2012. That said, oil might be an exception to the general trend in commodities. Rising geopolitical tensions, particularly the continuing face-off between Iran and the US, might lead to a spurt in prices. It might make sense for our oil companies to hedge this risk instead of buying oil in the spot market. As inflation fears abate, and emerging market central banks begin to cut rates, two things could happen. Lower commodity inflation would mean lower interest rates and better credit availability. This could set the floor to growth and slowly reverse the business cycle within these economies. Second, as the fear of untamed, runaway inflation in these economies abates, the global investor's comfort levels with their markets will increase. Which of the emerging markets will outperform and who will leave behind? In an environment in which global growth is likely to be weak, economies like India that have a powerful domestic consumption dynamic should lead; those dependent on exports should, prima facie, fall behind. Specifically for India, a fall in the exchange rate could not have come at a better time. It will help Indian exporters gain market share even if global trade remains depressed. More importantly, it could lead to massive import substitution that favours domestic producers.Let’s now focus on India and start with a caveat. It is important not to confuse a short run cyclical dip with a permanent derating of its long-term structural potential. The arithmetic is simple. Our growth rate can be in the range of 7-10 percent depending on policy action. Ten percent if we get everything right, 7 percent if we get it all wrong. Which policies and reforms are critical to taking us to our 10 percent potential? In judging this, let’s again be careful. Let’s not go by the laundry list of reforms that FIIs like to wave: The increase in foreign equity limits in foreign shareholding, greater voting rights for institutional shareholders in banks, FDI in retail, etc. These can have an impact only at the margin. We need not bend over backwards to appease the FIIs through these reforms they will invest in our markets when momentum picks up and will be the first to exit when the momentum flags, reforms or not. The reforms that we need are the ones that can actually raise our sustainable longterm growth rate. These have to come in areas like better targeting of subsidies, making projects in infrastructure viable so that they draw capital, raising the productivity of agriculture, improving healthcare and education, bringing the parallel economy under the tax net, implementing fundamental reforms in taxation like GST and the direct tax code and finally easing the MYRIAD
 
rules and regulations that make doing business in India such a nightmare. A number of these things do not require new legislation and can be done through executive order.MYRIAD
 ...
MCQ-> Read the following passage carefully and answer the questions given below it. Certain words/phrases have been printed in bold to help you locate them while answering some of the questions. The past quarter of a century has seen several bursts of selling by the world’s governments, mostly but not always in benign market conditions. Those in the OECD, a rich-country club, divested plenty of stuff in the 20 years before the global financial crisis. The first privatisation wave, which built up from the mid-1980s and peaked in 2000, was largely European. The drive to cut state intervention under Margaret Thatcher in Britain soon spread to the continent. The movement gathered pace after 1991, when eastern Europe put thousands of rusting state-owned enterprises (SOEs) on the block. A second wave came in the mid-2000s, as European economies sought to cash in on buoyant markets. But activity in OECD countries slowed sharply as the financial crisis began. In fact, it reversed. Bailouts of failing banks and companies have contributed to a dramatic increase in government purchases of corporate equity during the past five years. A more lasting fea ture is the expansion of the state capitalism practised by China and other emerging economic powers. Governments have actually bought more equity than they have sold in most years since 2007, though sales far exceeded purchases in 2013. Today privatisation is once again “alive and well”, says William Megginson of the Michael Price College of Business at the University of Oklahoma. According to a global tally he recently completed, 2012 was the third-best year ever, and preliminary evidence suggests that 2013 may have been better. However, the geography of sell-offs has changed, with emerging markets now to the fore. China, for instance, has been selling minority stakes in banking, energy, engineering and broadcasting; Brazil is selling airports to help finance a $20 billion investment programme. Eleven of the 20 largest IPOs between 2005 and 2013 were sales of minority stakes by SOEs, mostly in developing countries. By contrast, state-owned assets are now “the forgotten side of the balance-sheet” in many advanced economies, says Dag Detter, managing partner of Whetstone Solutions, an adviser to governments on asset restructuring. They shouldn’t be. Governments of OECD countries still oversee vast piles of assets, from banks and utilities to buildings, land and the riches beneath (see table). Selling some of these holdings could work wonders: reduce debt, finance infrastructure, boost economic efficiency. But governments often barely grasp the value locked up in them. The picture is clearest for companies or company-like entities held by central governments. According to data compiled by the OECD and published on its website, its 34 member countries had 2,111 fully or majority-owned SOEs, with 5.9m employees, at the end of 2012. Their combined value (allowing for some but not all pension-fund liabilities) is estimated at $2.2 trillion, roughly the same size as the global hedge-fund industry. Most are in network industries such as telecoms, electricity and transport. In addition, many countries have large minority stakes in listed firms. Those in which they hold a stake of between 10% and 50% have a combined market value of $890 billion and employ 2.9m people. The data are far from perfect. The quality of reporting varies widely, as do definitions of what counts as a state-owned company: most include only centralgovernment holdings. If all assets held at sub-national level, such as local water companies, were included, the total value could be more than $4 trillion. Reckons Hans Christiansen, an OECD economist. Moreover, his team has had to extrapolate because some QECD members, including America and Japan, provide patchy data. America is apparently so queasy about discussions of public ownership of -commercial assets that the Treasury takes no part in the OECD’s working group on the issue, even though it has vast holdings, from Amtrak and the 520,000-employee Postal Service to power generators and airports. The club’s efforts to calculate the value that SOEs add to, or subtract from, economies were abandoned after several countries, including America, refused to co-operate. Privatisation has begun picking up again recently in the OECD for a variety of reasons. Britain’s Conservative-led coalition is fbcused on (some would say obsessed with) reducing the public debt-to-GDP ratio. Having recently sold the Royal Mail through a public offering, it is hoping to offload other assets, including its stake in URENCO, a uranium enricher, and its student-loan portfolio. From January 8th, under a new Treasury scheme, members of the public and businesses will be allowed to buy government land and buildings on the open market. A website will shortly be set up to help potential buyers see which bits of the government’s /..337 billion-worth of holdings ($527 billion at today’s rate, accounting for 40% of developable sites round Britain) might be surplus. The government, said the chief treasury secretary, Danny Alexander, “should not act as some kind of compulsive hoarder”. Japan has different reasons to revive sell-offs, such as to finance reconstruction after its devastating earthquake and tsunami in 2011. Eyes are once again turning to Japan Post, a giant postal-to-financial-services conglomerate whose oftpostponed partial sale could at last happen in 2015 and raise (Yen) 4 trillion ($40 billion) or more. Australia wants to sell financial, postal and aviation assets to offset the fall in revenues caused by the commodities slowdown. In almost all the countries of Europe, privatisation is likely “to surprise on the upside” as long as markets continue to mend, reckons Mr Megginson. Mr Christiansen expects to see three main areas of activity in coming years. First will be the resumption of partial sell-offs in industries such as telecoms, transport and utilities. Many residual stakes in partly privatised firms could be sold down further. France, for instance, still has hefty stakes in GDF SUEZ, Renault, Thales and Orange. The government of Francois Hollande may be ideologically opposed to privatisation, but it is hoping to reduce industrial stakes to raise funds for livelier sectors, such as broadband and health. The second area of growth should be in eastern Europe, where hundreds of large firms, including manufacturers, remain in state hands. Poland will sell down its stakes in listed firms to make up for an expected reduction in EU structural funds. And the third area is the reprivatisation of financial institutions rescued during the crisis. This process is under way: the largest privatisation in 2012 was the $18 billion offering of America’s residual stake in AIG, an insurance company.Which of the following statements is not true in the context of the given passage ?
 ...
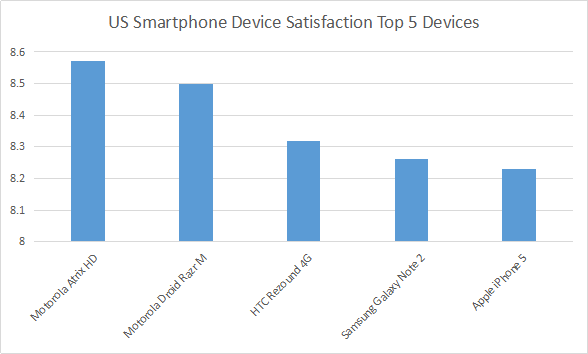
MCQ-> Please read the three reports (newspaper articles) on ranking of different players and products in smart phones industry and answer the questions that follow. Report 1: (Feb, 2013) Apple nabs crown as current top US mobile phone vendor Apple’s reign may not be long, as Samsung is poised to overtake Apple in April, 2013. For the first time since Apple entered the mobile phone market in 2007, it has been ranked the top mobile phone vendor in the US. For the latter quarter of 2012, sales of its iPhone accounted for 34 percent of all mobile phone sales in the US - including feature phones - according to the latest data from Strategy Analytics. While the iPhone has consistently been ranked the top smartphone sold in the US, market research firm NPD noted that feature phone sales have fallen off a cliff recently, to the point where 8 out of every 10 mobile phones sold in the US are now smartphones. That ratio is up considerably from the end of 2011, when smartphones had just cracked the 50 percent mark. Given this fact it’s no surprise that Apple, which only sells smartphones, has been able to reach the top of the overall mobile phone market domestically. For the fourth quarter of 2012, Apple ranked number one with 34 percent of the US mobile market, up from 25.6 percent year over year. Samsung grew similarly, up to 32.3 percent from 26.9 percent - but not enough to keep from slipping to second place. LG dropped to 9 percent from 13.7 percent, holding its third place spot. It should be noted that Samsung and LG both sell a variety of feature phones in addition to smartphones. Looking only at smartphones, the ranking is a little different according to NPD. Apple holds the top spot with 39 percent of the US smartphone market, while Samsung again sits at number two with 30 percent. Motorola manages to rank third with 7 percent, while HTC dropped to fourth with 6 percent. In the US smartphone market, LG is fifth with 6 percent. Note how the percentages aren’t all that different from overall mobile phone market share - for all intents and purposes, the smartphone market is the mobile phone market in the US going forward. Still, Samsung was the top mobile phone vendor overall for 2012, and Strategy Analytics expects Samsung to be back on top soon. “Samsung had been the number one mobile phone vendor in the US since 2008, and it will surely be keen to recapture that title in 2013 by launching improved new models such as the rumored Galaxy S4”. And while Apple is the top vendor overall among smartphones, its iOS platform is still second to the Android platform overall. Samsung is the largest vendor selling Android-based smartphones, but Motorola, HTC, LG, and others also sell Android devices, giving the platform a clear advantage over iOS both domestically and globally. Report 2: Reader’s Response (2013, Feb) I don’t actually believe the numbers for Samsung. Ever since the debacle in early 2011, when Lenovo called into question the numbers Samsung was touting for tablet shipments, stating that Samsung had only sold 20,000 of the 1.5 million tablets they shipped into the US the last quarter of 2010, Samsung (who had no response to Lenovo) has refused to supply quarterly sales numbers for smartphones or tablets. That’s an indication that their sales aren’t what analysts are saying. We can look to several things to help understand why. In the lawsuit between Apple and Samsung here last year, both were required to supply real sales numbers for devices under contention. The phones listed turned out to have sales between one third and one half of what had been guessed by IDC and others. Tablet sales were even worse. Of the 1.5 million tablets supposedly shipped to the US during that time, only 38,000 were sold. Then we have the usage numbers. Samsung tablets have only a 1.5% usage rate, where the iPad has over 90%. Not as much a difference with the phones but it’s still overwhelmingly in favor of iPhone. The problem is that with Apple’s sales, we have actual numbers to go by. The companies who estimate can calibrate what they do after those numbers come out. But with Samsung and many others, they can’t ever calibrate their methods, as there are no confirming numbers released from the firms. A few quarters ago, as a result, we saw iSupply estimate Samsung’s smartphone sales for the quarter at 32 million, with estimates from others all over the place up to 50 million. Each time some other company reported a higher number for that same quarter, the press dutifully used that higher number as THE ONE. But none of them was the one. Without accurate self-reporting of actual sales to the end users, none of these market share charts are worth a damn! Report 3: Contradictory survey (Feb, 2013) iPhone5 Ranks Fifth In U.S. Customer Satisfaction Survey inShare. The iPhone5 ranks fifth in customer satisfaction according to the results of a recent survey from OnDevice Research, a mobile device research group. In the poll, they asked 320,000 smartphone and tablet users from six different countries, how satisfied they were with their devices. According to 93,825 people from the US, Motorola Atrix HD is the most satisfying and Motorola’s Droid Razr took second spot. HTC Corp (TPE : 2498)’s Rezound 4G and Samsung Galaxy Note 2 took third and fourth spots, while Apple’s iPhone5 landed in fifth spot. It appears that Apple may be lagging in consumer interest. OnDevice Research, Sarah Quinn explained, “Although Apple created one of the most revolutionary devices of the past decade, other manufactures have caught up, with some Android powered devices now commanding higher levels of user satisfaction.” Despite the lower rankings, things aren’t looking too bad for Apple Inc. (NASDAQ:AAPL) elsewhere. In the United Kingdom, they ranked second place, right after HTC One X. Interesting enough, Apple did take top spot for overall satisfaction of mobile device, whereas Google Inc. (NASDAQ:GOOG) ranked second. Motorola Mobility Holdings Inc. (NYSE:NOK) took third, fourth, and fifth places respectively, while Sony Ericsson trailed behind at sixth place. The survey sampled mobile device users in the following countries: United States, United Kingdom, France, Germany, Japan, and Indonesia. Although OnDevice didn’t share the full list of devices mentioned in the survey, it does show some insight to what customers want. Unfortunately, there were still many questions regarding the survey that were left unanswered. Everyone wants to know why Google Inc. (NASDAQ:GOOG) was on the list when they are not an actual smartphone maker and why was Samsung Electronics Co., Ltd. (LON:BC94) on the bottom of the satisfaction list when the brand is leading elsewhere. Source: 92.825 US mobile users, July 2012 - January 2013 Fortunately, those questions were answered by OnDevice Research’s representative. He explained that the survey was conducted on mobile web where the survey software could detect the taker’s device and since user’s rate their satisfaction levels on a 1 to 10 scale, thanks to the Nexus device, Google was included.If you analyze the three reports above, which of the following statements would be the best inference?
 ...
Terms And Service:We do not guarantee the accuracy of available data ..We Provide Information On Public Data.. Please consult an expert before using this data for commercial or personal use
DMCA.com Protection Status Powered By:Omega Web Solutions
© 2002-2017 Omega Education PVT LTD...Privacy | Terms And Conditions