Toggle navigation
Home
Article Category
Question Papers
General Knowlege
Popular Pages
Multiple Choice Question in
Multiple Choice Question in 049
Multiple Choice Question in 2016
Multiple Choice Question in -current-affairs-2016
Multiple Choice Question in TRADES-INSTRUCTOR---GR-II---SMITHY---TECHNICAL-EDUCATION
Question Answer in ASSISTANT-PROFESSOR---COMPUTER-SCIENCE-AND-ENGINEERING---TECHNICAL-EDUCATION
Multiple Choice Question in ASSISTANT-PROFESSOR---COMPUTER-SCIENCE-AND-ENGINEERING---TECHNICAL-EDUCATION
Multiple Choice Question in english
Multiple Choice Question in abbreviations-abbreviations-m
Multiple Choice Question in SSC CHSL 7 March 2018 Morning Shift
Multiple Choice Question in 072/2016
Question Answer Bank
Multiple Choice Question Bank
Question Answer Category
Multiple Choice Question Category
Home
->
Multiple Choice Questions
1. What was the percentage increase in imports from 1997 to 1998 ?
(A): 72
(B): 56
(C): 28
(D): Data inadequate
Previous Question
Show Answer
Next Question
Add Tags
Report Error
Show Marks
Write Comment
Type in
(Press Ctrl+g to toggle between English and the chosen language)
Post reply
Comments
Tags
Show Similar Question And Answers
QA->If an officer is appointed to hold full charge of another post in addition to his own, he will be eligible for special allowance as a percentage of the minimum of the scale of pay of that post. This percentage shall not exceed:....
QA->If an officer is appointed to discharge the current duties of another post in addition to his own, he will be eligible for a special allowance as a percentage of the minimum of the scale of pay of the additional post. This percentage shall not exceed:....
QA->Which Indian port leads in imports....
QA->How is the difference between visible exports and visible imports defined?....
QA->Which Indian port leads in imports?....
MCQ->It is known that China’s GDP in 1998 was 7% higher than its value in 1997, while India’s GDP drew by 2% during the same period. The GDP of South Korea, on the other hand, fell by 5%.Which of the following statements is/are true?[list=1][*]Foreign equity inflows to China were higher in 1998 than in 1997.[*]Foreign equity inflows to China were lower in 1998 than in 1997.[*]Foreign equity inflows to India were higher in 1998 than in 1997.[*]Foreign equity inflows to South Korea decreased in 1998 relative to 1997.[*]Foreign equity inflows to South Korea increased in 1998 relative to 1997,[/list]....
MCQ-> Exhibit I as under provides the data of India's Merchandize Imports (Billion US Dollar) on left axis and Percentage of Food: Fuel, Manufactures and Ores & Metals lmports of India's on the right axis. Similarly; Exhibit 2 provides data of India's Merchandize Exports (Billion US Dollar) on left axis and Percentage exports of Food, Fuel, Manufactures and Ores & Metals on the right axis. Attempt the questions in the context of information provided as under:A.Trade Balance = Import Minus Exports b:Trade Deficit If Imports are more than Exports c:TradeSurplus= If Exports are more than Imports
Exhibit 1: India's Total Merchandize Imports (US Dollar in Billion) and Percentage Imports of Food, Fuel, Manufacturers and Ores and Metals (2012 - 2016)
Exhibit 2: India's Total Merchandize Exports (US Dollar in Billion) and Percentage Exports of Food, Fuel, Manufacturers and Ores and Metals (2012 - 2016)
What shall be approximate Manufactures exportS of India in ihe year 2016 based on average exports for the period 2012-2016?
....
MCQ-> Read the given passage carefully and select the best answer to each question out of the four given alternatives.A growing demand for organics, and the near-total reliance by US farmers on genetically modified corn and soybeans, is driving a surge in imports from other nations where crops largely are free of bioengineering. Imports such as corn from Romania and soybeans from India are booming, according to an analysis of US trade data released Wednesday by the Organic Trade Association and Pennsylvania State University. That shows a potential market for US growers willing to avoid the use of artificial chemicals and genetically modified seeds, said Laura Batcha, chief executive officer of the association, which includes Whole Foods Market Inc., Whitewave Foods Co. and Earthbound Farm LLC. The report is "a help-wanted sign" for US farmers, Batcha said. "There are market distortions that are pretty striking." Most of the corn and soybean shipments become feed for chickens and cows so they can be certified organic under US Department of Agriculture guidelines. Organic poultry and dairy operators shun feed made with seeds from Monsanto Co. and other domestic suppliers in favor of foreign products even as the US remains the world’s top grower of corn and soybeans. As a result, imports to the US of Romanian corn rose to $11.6 million in 2014 from $545,000 the year before. Soybean imports from India more than doubled to $73.8 million. Rising consumer demand in what’s been a niche market is creating shortages, pushing companies that supply farms needing organic feed to seek out foreign sources. About 90% of US corn and soy is bioengineered, thus automatically ineligible for the organic label.What is driving a surge in imports from other nations?
....
MCQ-> Directions for the next 4 questions: Answer these questions based on the table below:The table shows trends in external transactions of Indian corporate sector during the period 1993-94 to 1997-98. In addition, following definitions hold good:Sales, Imports, and Exports, respectively denote the sales, imports and exports in year i.Deficit in year I, Deficit1 = Imports - ExportsDeficit Intensity in year I, DI = Deficit/Sales Growth rate of deficit intensity in year I, GDI = $$\frac{DI_i - DI_{i-1}}{DI_{i-1}}$$Further, note that all imports are classified as either raw material or capital goods. Trends in External Transactions of Indian Corporate Sector (All figures in %)
The highest growth rate in deficit intensity was recorded in:
....
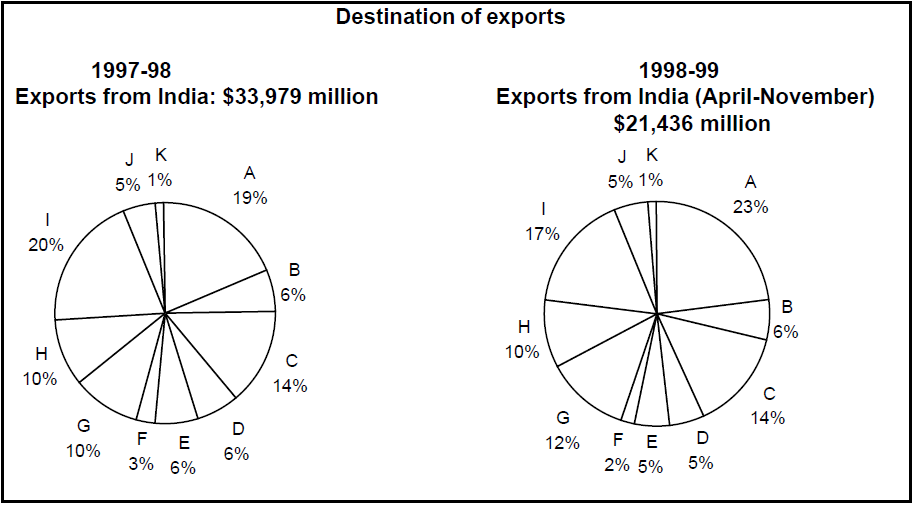
MCQ-> Consider the information provided in the figure below relating to India's foreign trade in 1997-98 and the first eight months of 1998-99.Total trade with a region is defined as the sum of exports to and imports from that region. Trade deficit is defined as the excess of imports over exports. Trade deficit may be negative.A:USA. B:Germany C:Other EU. D:U.K. E:Japan F:Russia G:Other East Europe H:OPEC I:Asia J:Other LDCs K:Others
What is the region with which India had the highest total trade in 1997-98?
....
×
×
Type The Issue
×
Your Marks
Terms And Service:We do not guarantee the accuracy of available data ..We Provide Information On Public Data.. Please consult an expert before using this data for commercial or personal use
Powered By:Omega Web Solutions
© 2002-2017 Omega Education PVT LTD...
Privacy
|
Terms And Conditions
 Powered By:Omega Web Solutions
 Exhibit 2: India's Total Merchandize Exports (US Dollar in Billion) and Percentage Exports of Food, Fuel, Manufacturers and Ores and Metals (2012 - 2016)
 What shall be approximate Manufactures exportS of India in ihe year 2016 based on average exports for the period 2012-2016?
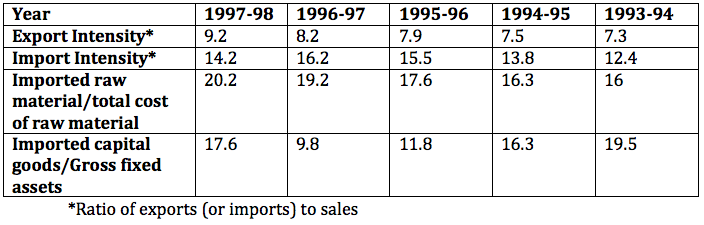 The highest growth rate in deficit intensity was recorded in:
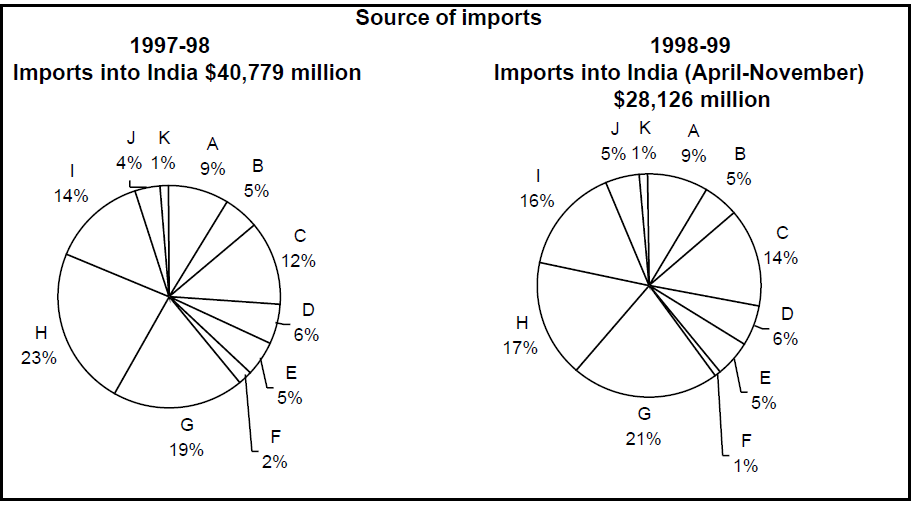
 What is the region with which India had the highest total trade in 1997-98?