Toggle navigation
Home
Article Category
Question Papers
General Knowlege
Popular Pages
Multiple Choice Question in 049
Multiple Choice Question in
Multiple Choice Question in TRADES-INSTRUCTOR---GR-II---SMITHY---TECHNICAL-EDUCATION
Multiple Choice Question in -current-affairs-2016
Question Answer in ASSISTANT-PROFESSOR---COMPUTER-SCIENCE-AND-ENGINEERING---TECHNICAL-EDUCATION
Multiple Choice Question in ASSISTANT-PROFESSOR---COMPUTER-SCIENCE-AND-ENGINEERING---TECHNICAL-EDUCATION
Multiple Choice Question in english
Multiple Choice Question in abbreviations-abbreviations-m
Multiple Choice Question in SSC CHSL 7 March 2018 Morning Shift
Multiple Choice Question in 072/2016
Multiple Choice Question in 100/2016
Question Answer Bank
Multiple Choice Question Bank
Question Answer Category
Multiple Choice Question Category
Home
->
Multiple Choice Questions
1. Under stock and debtors system in branch accounts the credit sales are
(A): Debited to debtors a/c
(B): Debited to cash a/c
(C): Credited to branch a/c
(D): Debited to branch a/c
Previous Question
Show Answer
Next Question
Add Tags
Report Error
Show Marks
Write Comment
Type in
(Press Ctrl+g to toggle between English and the chosen language)
Post reply
Comments
Tags
Show Similar Question And Answers
QA->The term goods under Section 2(d) of the Central Sales Tax Act 1956 includes:....
QA->Appropriation Accounts, Finance accounts, and Audit Reports(Civil) laid before the L.A. are examined by:....
QA->Palaeobotany is the branch of botany; what do we study about in this branch?....
QA->Phycology is the branch of botany; what do we study about in this branch?....
QA->Mycology is the branch of botany; what do we study about in that branch?....
MCQ-> Read the following passage carefully and answer the questions given below it. Certain words are printed in bold to help you to locate them while answering some of the questions.A large majority of the poor in India are outside the formal banking system. The policy of financial inclusion sets out to
remedy
this by making available a basic banking ‘no frills’ account either with nil or very minimum balances as well as charges that would make such accounts
accessible
to vast sections of the population. However, the mere opening of a bank account in the name of every household or adult person may not be enough, unless these accounts and financial services offered to them are used by the account holders. At present, commercial banks do not find it viable to provide services to the poor especially in the rural areas because of huge transaction costs, low volumes of savings in the accounts, lack of information on the account holder, etc. For the poor. interacting with the banks with their paper work, economic costs of going to the bank and the need for flexibility in their accounts, make them turn to other informal channels or other institutions. Thus, there are constraints on both the supply and the demand side.Till now, banks were looking at these accounts from a
purely
credit perspective. Instead, they should look at this from the point of view of meeting the huge need of the poor for savings. Poor households want to save and, contrary to the common perception, do have the funds to save, but lack control. Informal mutual saving systems like the Rotating Savings and Credit Associations (ROSCAs), widespread in Africa, and ‘thrift and credit groups’ in India
demonstrate
that poor households save. For the poor household, which lack access to the formal insurance system and the credit system, savings provide a safety net and help them tide over crises. Savings can also keep them away from the clutches of moneylenders, make formal institutions more favourable to lending to them, encourage investment and make them shift to more productive activities, as they may invest in slightly more risky activities which have an overall higher rate of return.Research shows the efficacy of informal institutions in increasing the savings of the small account holders. An MFI in the Philippines, which had existing account holders, was studied. They offered new products with ‘commitment features’. One type had withdrawal restrictions in the sense that it required individuals to restrict their right to withdraw any funds from their own accounts until they reached a self-specified and documented goal. The other type was deposit options. Clients could purchase a locked box for a small fee. The key was with the bank and the client has to bring the box to the bank to make the deposit. He could not dip into the savings even if he wanted to. These accounts did not pay extra money and were illiquid. Surprisingly, these products were popular even though these had restrictions. Results showed that those who opted for these accounts with restrictions had substantially greater savings rates than those who did not. The policy of financial inclusion can be a success if financial inclusion focuses onboth saving needs and credit needs, having a diversified product portfolio for the poor but recognising that self-control problems need to be addressed by having commitment devices. The products with commitment features should be
optional
. Furthermore transaction costs for the poor could be cut down, by making innovative use of technology available and offering mobile vans with ATM and deposit collection features which could visit villages periodically.What is the aim of the financial inclusion policy ?
....
MCQ-> Please read the three reports (newspaper articles) on ranking of different players and products in smart phones industry and answer the questions that follow. Report 1: (Feb, 2013)
Apple nabs crown as current top US mobile phone vendor
Apple’s reign may not be long, as Samsung is poised to overtake Apple in April, 2013. For the first time since Apple entered the mobile phone market in 2007, it has been ranked the top mobile phone vendor in the US. For the latter quarter of 2012, sales of its iPhone accounted for 34 percent of all mobile phone sales in the US - including feature phones - according to the latest data from Strategy Analytics. While the iPhone has consistently been ranked the top smartphone sold in the US, market research firm NPD noted that feature phone sales have fallen off a cliff recently, to the point where 8 out of every 10 mobile phones sold in the US are now smartphones. That ratio is up considerably from the end of 2011, when smartphones had just cracked the 50 percent mark. Given this fact it’s no surprise that Apple, which only sells smartphones, has been able to reach the top of the overall mobile phone market domestically. For the fourth quarter of 2012, Apple ranked number one with 34 percent of the US mobile market, up from 25.6 percent year over year. Samsung grew similarly, up to 32.3 percent from 26.9 percent - but not enough to keep from slipping to second place. LG dropped to 9 percent from 13.7 percent, holding its third place spot. It should be noted that Samsung and LG both sell a variety of feature phones in addition to smartphones. Looking only at smartphones, the ranking is a little different according to NPD. Apple holds the top spot with 39 percent of the US smartphone market, while Samsung again sits at number two with 30 percent. Motorola manages to rank third with 7 percent, while HTC dropped to fourth with 6 percent. In the US smartphone market, LG is fifth with 6 percent. Note how the percentages aren’t all that different from overall mobile phone market share - for all intents and purposes, the smartphone market is the mobile phone market in the US going forward. Still, Samsung was the top mobile phone vendor overall for 2012, and Strategy Analytics expects Samsung to be back on top soon. “Samsung had been the number one mobile phone vendor in the US since 2008, and it will surely be keen to recapture that title in 2013 by launching improved new models such as the rumored Galaxy S4”. And while Apple is the top vendor overall among smartphones, its iOS platform is still second to the Android platform overall. Samsung is the largest vendor selling Android-based smartphones, but Motorola, HTC, LG, and others also sell Android devices, giving the platform a clear advantage over iOS both domestically and globally.
Report 2: Reader’s Response (2013, Feb)
I don’t actually believe the numbers for Samsung. Ever since the debacle in early 2011, when Lenovo called into question the numbers Samsung was touting for tablet shipments, stating that Samsung had only sold 20,000 of the 1.5 million tablets they shipped into the US the last quarter of 2010, Samsung (who had no response to Lenovo) has refused to supply quarterly sales numbers for smartphones or tablets. That’s an indication that their sales aren’t what analysts are saying. We can look to several things to help understand why. In the lawsuit between Apple and Samsung here last year, both were required to supply real sales numbers for devices under contention. The phones listed turned out to have sales between one third and one half of what had been guessed by IDC and others. Tablet sales were even worse. Of the 1.5 million tablets supposedly shipped to the US during that time, only 38,000 were sold. Then we have the usage numbers. Samsung tablets have only a 1.5% usage rate, where the iPad has over 90%. Not as much a difference with the phones but it’s still overwhelmingly in favor of iPhone. The problem is that with Apple’s sales, we have actual numbers to go by. The companies who estimate can calibrate what they do after those numbers come out. But with Samsung and many others, they can’t ever calibrate their methods, as there are no confirming numbers released from the firms. A few quarters ago, as a result, we saw iSupply estimate Samsung’s smartphone sales for the quarter at 32 million, with estimates from others all over the place up to 50 million. Each time some other company reported a higher number for that same quarter, the press dutifully used that higher number as THE ONE. But none of them was the one. Without accurate self-reporting of actual sales to the end users, none of these market share charts are worth a damn!
Report 3: Contradictory survey (Feb, 2013)
iPhone5 Ranks Fifth In U.S. Customer Satisfaction Survey inShare. The iPhone5 ranks fifth in customer satisfaction according to the results of a recent survey from OnDevice Research, a mobile device research group. In the poll, they asked 320,000 smartphone and tablet users from six different countries, how satisfied they were with their devices. According to 93,825 people from the US, Motorola Atrix HD is the most satisfying and Motorola’s Droid Razr took second spot. HTC Corp (TPE : 2498)’s Rezound 4G and Samsung Galaxy Note 2 took third and fourth spots, while Apple’s iPhone5 landed in fifth spot. It appears that Apple may be lagging in consumer interest. OnDevice Research, Sarah Quinn explained, “Although Apple created one of the most revolutionary devices of the past decade, other manufactures have caught up, with some Android powered devices now commanding higher levels of user satisfaction.” Despite the lower rankings, things aren’t looking too bad for Apple Inc. (NASDAQ:AAPL) elsewhere. In the United Kingdom, they ranked second place, right after HTC One X. Interesting enough, Apple did take top spot for overall satisfaction of mobile device, whereas Google Inc. (NASDAQ:GOOG) ranked second. Motorola Mobility Holdings Inc. (NYSE:NOK) took third, fourth, and fifth places respectively, while Sony Ericsson trailed behind at sixth place. The survey sampled mobile device users in the following countries: United States, United Kingdom, France, Germany, Japan, and Indonesia. Although OnDevice didn’t share the full list of devices mentioned in the survey, it does show some insight to what customers want. Unfortunately, there were still many questions regarding the survey that were left unanswered. Everyone wants to know why Google Inc. (NASDAQ:GOOG) was on the list when they are not an actual smartphone maker and why was Samsung Electronics Co., Ltd. (LON:BC94) on the bottom of the satisfaction list when the brand is leading elsewhere.
Source: 92.825 US mobile users, July 2012 - January 2013
Fortunately, those questions were answered by OnDevice Research’s representative. He explained that the survey was conducted on mobile web where the survey software could detect the taker’s device and since user’s rate their satisfaction levels on a 1 to 10 scale, thanks to the Nexus device, Google was included.If you analyze the three reports above, which of the following statements would be the best inference?
....
MCQ-> Read the following information and tables and answer the questions that follow.Torrent Enterprises sells air conditioners of Eagle Brand in the retail market of Delhi. The month-wise total number of Window Air Conditioner (WAC) units sold by Torrent during April 2014 to March 2015 are shown below in Table A. Table B shows the share of different types of WACs in total monthly sales for the said period. Number of Units Sold by Torrent Enterprises During the Period April 14 to March 15 Table A
Table B
Performance measures are as follows: Half Yearly Sales Performance:$$\frac{\text{Oct 14 to Mar 15 Average Sales - April 14 to Sep 14 Average Sales}}{\text{April 14 to Sep 14 Average Sales}}$$Monthly Sales Performance: $$\frac{\text{Current Month Sales - Pervious Month Sales}}{\text{Previous Month Sales}}$$Sales Volatility: $$\frac{\text{Maximum Monthly Sales - Minimum Monthly Sales}}{\text{Average Monthly Sales}}$$What is the closest average number of 11⁄2 ton Window ACs sold by Torrent Enterprises during April 2014 - March 2015?
....
MCQ->Opening balance of debtors is Rs. 30,000, Cash received from debtors is Rs. 6.000, Goods sold to debtors is Rs. 40,000, Goods returned by debtors is 1000. What is the closing balance?....
MCQ-> The multi-layered pie-chart below shows the sales of LED television sets for a big retail electronics outlet during 2016 and 2017. The outer layer shows the monthly sales during this period, with each label showing the month followed by sales figure of that month. For some months, the sales figures are not given in the chart. The middle-layer shows quarterwise aggregate sales figures (in some cases, aggregate quarter-wise sales numbers are not given next to the quarter). The innermost layer shows annual sales. It is known that the sales figures during the three months of the second quarter (April, May, June) of 2016 form an arithmetic progression, as do the three monthly sales figures in the fourth quarter (October, November, December) of that year.
What is the percentage increase in sales in December 2017 as compared to the sales in December 2016?
....
×
×
Type The Issue
×
Your Marks
Terms And Service:We do not guarantee the accuracy of available data ..We Provide Information On Public Data.. Please consult an expert before using this data for commercial or personal use
Powered By:Omega Web Solutions
© 2002-2017 Omega Education PVT LTD...
Privacy
|
Terms And Conditions
 Powered By:Omega Web Solutions
 Source: 92.825 US mobile users, July 2012 - January 2013
Fortunately, those questions were answered by OnDevice Research’s representative. He explained that the survey was conducted on mobile web where the survey software could detect the taker’s device and since user’s rate their satisfaction levels on a 1 to 10 scale, thanks to the Nexus device, Google was included.If you analyze the three reports above, which of the following statements would be the best inference?
Source: 92.825 US mobile users, July 2012 - January 2013
Fortunately, those questions were answered by OnDevice Research’s representative. He explained that the survey was conducted on mobile web where the survey software could detect the taker’s device and since user’s rate their satisfaction levels on a 1 to 10 scale, thanks to the Nexus device, Google was included.If you analyze the three reports above, which of the following statements would be the best inference? Table B
 Performance measures are as follows:
Half Yearly Sales Performance:$$\frac{\text{Oct 14 to Mar 15 Average Sales - April 14 to Sep 14 Average Sales}}{\text{April 14 to Sep 14 Average Sales}}$$Monthly Sales Performance:
$$\frac{\text{Current Month Sales - Pervious Month Sales}}{\text{Previous Month Sales}}$$Sales Volatility:
$$\frac{\text{Maximum Monthly Sales - Minimum Monthly Sales}}{\text{Average Monthly Sales}}$$What is the closest average number of 11⁄2 ton Window ACs sold by Torrent Enterprises during April 2014 - March 2015?
Performance measures are as follows:
Half Yearly Sales Performance:$$\frac{\text{Oct 14 to Mar 15 Average Sales - April 14 to Sep 14 Average Sales}}{\text{April 14 to Sep 14 Average Sales}}$$Monthly Sales Performance:
$$\frac{\text{Current Month Sales - Pervious Month Sales}}{\text{Previous Month Sales}}$$Sales Volatility:
$$\frac{\text{Maximum Monthly Sales - Minimum Monthly Sales}}{\text{Average Monthly Sales}}$$What is the closest average number of 11⁄2 ton Window ACs sold by Torrent Enterprises during April 2014 - March 2015?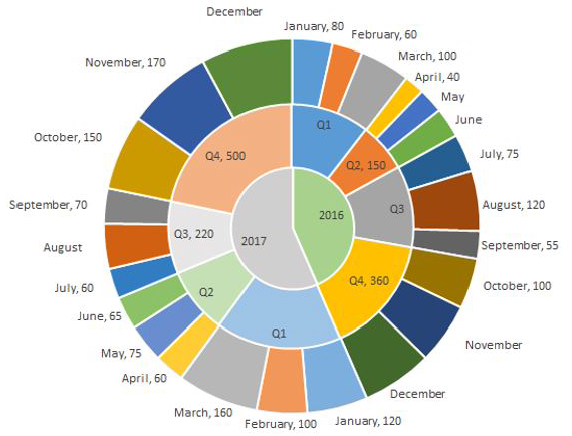 What is the percentage increase in sales in December 2017 as compared to the sales in December 2016?