Toggle navigation
Home
Article Category
Question Papers
General Knowlege
Popular Pages
Multiple Choice Question in 049
Multiple Choice Question in
Multiple Choice Question in 2016
Multiple Choice Question in TRADES-INSTRUCTOR---GR-II---SMITHY---TECHNICAL-EDUCATION
Multiple Choice Question in -current-affairs-2016
Question Answer in ASSISTANT-PROFESSOR---COMPUTER-SCIENCE-AND-ENGINEERING---TECHNICAL-EDUCATION
Multiple Choice Question in ASSISTANT-PROFESSOR---COMPUTER-SCIENCE-AND-ENGINEERING---TECHNICAL-EDUCATION
Multiple Choice Question in english
Multiple Choice Question in abbreviations-abbreviations-m
Multiple Choice Question in SSC CHSL 7 March 2018 Morning Shift
Multiple Choice Question in 072/2016
Question Answer Bank
Multiple Choice Question Bank
Question Answer Category
Multiple Choice Question Category
Home
->
Multiple Choice Questions
1. In how many years, the number of students in stream B is more than the number of students in stream A?
(A): 5
(B): 3
(C): 2
(D): 1
Previous Question
Show Answer
Next Question
Add Tags
Report Error
Show Marks
Write Comment
Type in
(Press Ctrl+g to toggle between English and the chosen language)
Post reply
Comments
Tags
SSC MTS 21 September 2017 Shift 2
Show Similar Question And Answers
QA->In a class of 50 students, 32 students passed in English and 38 students passed in Mathematics. If 20 students passed in both the subjects, the number of students who passed neither English nor Mathematics is :....
QA->In a hostel, there is enough food for 50 students to last for 30 days. After 6 days 25 more students are admitted to the hostel. Now, how many more days the food is going to last?....
QA->In a class of 20 students the average age is 16 years.If the age of the class teacher is added to that of students,the average age of the class becomes 17 years.What is the age of the teacher?....
QA->The captain of the South Korean ferry who has been sentenced to 36 years in prison for negligence and abandoning passengers when his ship sank earlier this year, killing more than 300 people, mostly high school students.?....
QA->A is taller than B; B is taller than C; D is taller than E and E is taller than B. Who is the shortest?....
MCQ-> Study the following information carefully to answer the given questions.This data is regarding number of Junior Coliege students, Graduate students and Post-Graduate students (PG) only, studying in colleges A, B, C and D. The respective ratio between the total number of students studying in the Colleges A, B, C and D is 3 : 5 : 2 : 5. In College A, 40% of the total number of students are Junior College students. Out of the remaining, the respective ratio between the number of Graduate students and number of PG students is 5 : 4. In College B, $${2 \over 5}$$th of the total number of students are Junior College students. Out of the remaining, the respective ratio between the number of Graduate students and number of PG students is 5 : 3. In College C, 50% of the total number of students are Junior College students. Out of the remaining, $${5 \over 8}$$th are Graduate students and the remaining are PG students.In College D, 35% of the total number of students are Graduate students,$$ {8 \over {13}}$$th of the remaining students are Junior College students and the rest 1500 are PG students.What is the respective ratio between the total number of graduate students in College A and the total number of Graduate students in College B?
....
MCQ-> Read the following passage carefully and answer the questions given below it. Certain words/phrases have been printed in bold tohelp you locate them while answering some of the questions. During the last few years, a lot of hype has been heaped on the BRICS (Brazil, Russia, India, China, and South Africa). With their large populations and rapid growth, these countries, so the argument goes, will soon become some of the largest economies in the world and, in the case of China, the largest of all by as early as 2020. But the BRICS, as well as many other emerging-market economieshave recently experienced a sharp economic slowdown. So, is the honeymoon over? Brazil’s GDP grew by only 1% last year, and may not grow by more than 2% this year, with its potential growth barely above 3%. Russia’s economy may grow by barely 2% this year, with potential growth also at around 3%, despite oil prices being around $100 a barrel. India had a couple of years of strong growth recently (11.2% in 2010 and 7.7% in 2011) but slowed to 4% in 2012. China’s economy grew by 10% a year for the last three decades, but slowed to 7.8% last year and risks a hard landing. And South Africa grew by only 2.5% last year and may not grow faster than 2% this year. Many other previously fast-growing emerging-market economies – for example, Turkey, Argentina, Poland, Hungary, and many in Central and Eastern Europe are experiencing a similar slowdown. So, what is ailing the BRICS and other emerging markets? First, most emerging-market economies were overheating in 2010-2011, with growth above potential and inflation rising and exceeding targets. Many of them thus tightened monetary policy in 2011, with consequences for growth in 2012 that have carried over into this year. Second, the idea that emerging-market economies could fully decouple from economic weakness in advanced economies was
farfetched
: recession in the eurozone, near-recession in the United Kingdom and Japan in 2011-2012, and slow economic growth in the United States were always likely to affect emerging market performance negatively – via trade, financial links, and investor confidence. For example, the ongoing euro zone downturn has hurt Turkey and emergingmarket economies in Central and Eastern Europe, owing to trade links. Third, most BRICS and a few other emerging markets have moved toward a variant of state capitalism. This implies a slowdown in reforms that increase the private sector’s productivity and economic share, together with a greater economic role for state-owned enterprises (and for state-owned banks in the allocation of credit and savings), as well as resource nationalism, trade protectionism, import substitution industrialization policies, and imposition of capital controls. This approach may have worked at earlier stages of development and when the global financial crisis caused private spending to fall; but it is now distorting economic activity and depressing potential growth. Indeed, China’s slowdown reflects an economic model that is, as former Premier Wen Jiabao put it, “unstable, unbalanced, uncoordinated, and unsustainable,” and that now is adversely affecting growth in emerging Asia and in commodity-exporting emerging markets from Asia to Latin America and Africa. The risk that China will experience a hard landing in the next two years may further hurt many emerging economies. Fourth, the commodity super-cycle that helped Brazil, Russia, South Africa, and many other commodity-exporting emerging markets may be over. Indeed, a boom would be difficult to sustain, given China’s slowdown, higher investment in energysaving technologies, less emphasis on capital-and resource-oriented growth models around the world, and the delayed increase in supply that high prices induced. The fifth, and most recent, factor is the US Federal Reserve’s signals that it might end its policy of quantitative easing earlier than expected, and its hints of an even tual exit from zero interest rates. both of which have caused turbulence in emerging economies’ financial markets. Even before the Fed’s signals, emergingmarket equities and commodities had underperformed this year, owing to China’s slowdown. Since then, emerging-market currencies and fixed-income securities (government and corporate bonds) have taken a hit. The era of cheap or zerointerest money that led to a wall of liquidity chasing high yields and assets equities, bonds, currencies, and commodities – in emerging markets is drawing to a close. Finally, while many emerging-market economies tend to run current-account surpluses, a growing number of them – including Turkey, South Africa, Brazil, and India – are running deficits. And these deficits are now being financed in riskier ways: more debt than equity; more short-term debt than longterm debt; more foreign-currency debt than local-currency debt; and more financing from fickle cross-border interbank flows. These countries share other weaknesses as well: excessive fiscal deficits, abovetarget inflation, and stability risk (reflected not only in the recent political turmoil in Brazil and Turkey, but also in South Africa’s labour strife and India’s political and electoral uncertainties). The need to finance the external deficit and to avoid excessive depreciation (and even higher inflation) calls for raising policy rates or keeping them on hold at high levels. But monetary tightening would weaken already-slow growth. Thus, emerging economies with large twin deficits and other macroeconomic fragilities may experience further downward pressure on their financial markets and growth rates. These factors explain why growth in most BRICS and many other emerging markets has slowed sharply. Some factors are cyclical, but others – state capitalism, the risk of a hard landing in China, the end of the commodity supercycle -are more structural. Thus, many emerging markets’ growth rates in the next decade may be lower than in the last – as may the outsize returns that investors realised from these economies’ financial assets (currencies, equities. bonds, and commodities). Of course, some of the better-managed emerging-market economies will continue to experitnce rapid growth and asset outperformance. But many of the BRICS, along with some other emerging economies, may hit a thick wall, with growth and financial markets taking a serious beating.Which of the following statement(s) is/are true as per the given information in the passage ? A. Brazil’s GDP grew by only 1% last year, and is expected to grow by approximately 2% this year. B. China’s economy grew by 10% a year for the last three decades but slowed to 7.8% last year. C. BRICS is a group of nations — Barzil, Russia, India China and South Africa.....
MCQ-> Read the given information carefully and answer the questions.Each of the six sections, U, V, W, X, Y and Z of the same class has different number of students. Only Z has more number of students than X. V has more number of students than Y but less than U. W has more number of students than both Y and U. The section having the third highest number of students has 39 students. Y has 24 students.If the number of students in sections W + Z is sixty six more than the number of students in section Y, how many of students are there in section Z ?
....
MCQ->In University `PQR, the total number of students is 28% of the total number of students in University `XYZ. If in University ‘PQR’ 60% of the total students study either in science stream or in commerce stream and the respective ratio between the number of students studying in science stream and the number of students studying in commerce stream is 7 : 5, what is the number of students studying in science stream?....
MCQ-> There were seven elective courses - E1 to E7 - running in a specific term in a college. Each of the 300 students enrolled had chosen just one elective from among these seven. However, before the start of the term, E7 was withdrawn as the instructor concerned had left the college. The students who had opted for E7 were allowed to join any of the remaining electives. Also, the students who had chosen other electives were given one chance to change their choice. The table below captures the movement of the students from one elective to another during this process. Movement from one elective to the same elective simply means no movement. Some numbers in the table got accidentally erased; however, it is known that these were either 0 or 1.
Further, the following are known: 1. Before the change process there were 6 more students in E1 than in E4, but after the reshuffle, the number of students in E4 was 3 more than that in E1. 2. The number of students in E2 increased by 30 after the change process. 3. Before the change process, E4 had 2 more students than E6, while E2 had 10 more students than E3.How many elective courses among E1 to E6 had a decrease in their enrollments after the change process?
....
×
×
Type The Issue
×
Your Marks
Terms And Service:We do not guarantee the accuracy of available data ..We Provide Information On Public Data.. Please consult an expert before using this data for commercial or personal use
Powered By:Omega Web Solutions
© 2002-2017 Omega Education PVT LTD...
Privacy
|
Terms And Conditions
 Powered By:Omega Web Solutions
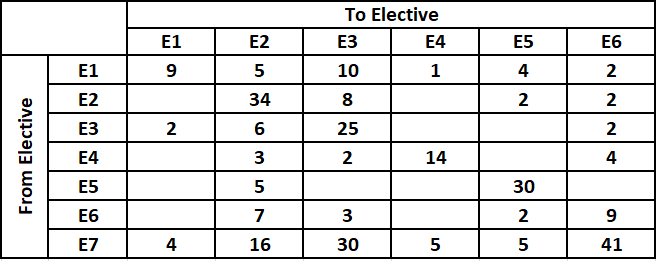 Further, the following are known:
1. Before the change process there were 6 more students in E1 than in E4, but after the reshuffle, the number of students in E4 was 3 more than that in E1.
2. The number of students in E2 increased by 30 after the change process.
3. Before the change process, E4 had 2 more students than E6, while E2 had 10 more students than E3.How many elective courses among E1 to E6 had a decrease in their enrollments after the change process?
Further, the following are known:
1. Before the change process there were 6 more students in E1 than in E4, but after the reshuffle, the number of students in E4 was 3 more than that in E1.
2. The number of students in E2 increased by 30 after the change process.
3. Before the change process, E4 had 2 more students than E6, while E2 had 10 more students than E3.How many elective courses among E1 to E6 had a decrease in their enrollments after the change process?