1. The bar chart given below shows the sales of 3 types of cars in the Indian automotive industry over 4 years. All the sales figures have been shown in terms of '000 units.  Which of the following type of car has the highest increase in sales from 2009 to 2012?


Write Comment

Type in
(Press Ctrl+g to toggle between English and the chosen language)

Comments

  • By: anil on 05 May 2019 01.47 am
    % increase in sales from 2009 to 2012 of :  Hatchback : $$frac{(800-500)}{500} imes100$$ = 60% Sedan : $$frac{(625-450)}{450} imes100$$ = 41.17% SUV : $$frac{(750-150)}{150} imes100$$ = 400%     [MAX] => Ans - (C)
Show Similar Question And Answers
QA->Direct Labour cost is Rs.20,000, Factory overheads expense is Rs.10,000, opening and closing work-in-progress are Rs.15,000 and Rs.18,000 respectively, then works cost will be…….....
QA->What is the number of basic units in the International System of Units?....
QA->How manyelements have been added to the periodic table chart on November 30, 2016?....
QA->Three processes A, B, C have peak time demands of 3, 4, 6 resource units respectively of a particular type. What is the minimum number of resources to be provided to ensure that deadlock never occurs?....
QA->Denomination of high value notes of Rs. 1,000, Rs. 5,000 and Rs. 10,000 demonetised.....
MCQ-> The bar chart given below shows the sales of 3 types of cars in the Indian automotive industry over 4 years. All the sales figures have been shown in terms of '000 units.  Which of the following type of car has the highest increase in sales from 2009 to 2012?
 ....
MCQ-> DI
 rectI
 ons: I
 n the followI
 ng passage there are blanks, each of whI
 ch has been numbered. These numbers are prI
 nted below the passage and agaI
 nst each, fI
 ve words/ phrases are suggested, one of whI
 ch fI
 ts the blank approprI
 ately. FI
 nd out the approprI
 ate word/ phrase I
 n each case.There I
 s a consI
 derable amount of research about the factors that make a company I
 nnovate. So I
 s I
 t possI
 ble to create an envI
 ronment (I
 ) to I
 nnovatI
 on? ThI
 s I
 s a partI
 cularly pertI
 nent (I
 I
 ) for I
 ndI
 a today. MassI
 ve problems I
 n health, educatI
 on etc (I
 I
 I
 ) be solved usI
 ng a conventI
 onal Approach but (I
 V) creatI
 ve and I
 nnovatI
 ve solutI
 ons that can ensure radI
 cal change and (V). There are several factors I
 n I
 ndI
 a's (VI
 ). Few countrI
 es have the rI
 ch dI
 versI
 ty that I
 ndI
 a or I
 ts large, young populatI
 on (VI
 I
 ). WhI
 le these (VI
 I
 I
 ) I
 nnovatI
 on polI
 cy I
 nterventI
 ons certaI
 n addI
 tI
 onal steps are also requI
 red. These I
 nclude (I
 X) I
 nvestment I
 n research and development by (X) the government and the prI
 vate sector, easy transfer of technology from the academI
 c world etc. To fulfI
 ll I
 ts promI
 se of beI
 ng prosperous and to be at the forefront, I
 ndI
 a must be I
 nnovatI
 ve.I
 ....
MCQ-> Please read the three reports (newspaper articles) on ranking of different players and products in smart phones industry and answer the questions that follow. Report 1: (Feb, 2013) Apple nabs crown as current top US mobile phone vendor Apple’s reign may not be long, as Samsung is poised to overtake Apple in April, 2013. For the first time since Apple entered the mobile phone market in 2007, it has been ranked the top mobile phone vendor in the US. For the latter quarter of 2012, sales of its iPhone accounted for 34 percent of all mobile phone sales in the US - including feature phones - according to the latest data from Strategy Analytics. While the iPhone has consistently been ranked the top smartphone sold in the US, market research firm NPD noted that feature phone sales have fallen off a cliff recently, to the point where 8 out of every 10 mobile phones sold in the US are now smartphones. That ratio is up considerably from the end of 2011, when smartphones had just cracked the 50 percent mark. Given this fact it’s no surprise that Apple, which only sells smartphones, has been able to reach the top of the overall mobile phone market domestically. For the fourth quarter of 2012, Apple ranked number one with 34 percent of the US mobile market, up from 25.6 percent year over year. Samsung grew similarly, up to 32.3 percent from 26.9 percent - but not enough to keep from slipping to second place. LG dropped to 9 percent from 13.7 percent, holding its third place spot. It should be noted that Samsung and LG both sell a variety of feature phones in addition to smartphones. Looking only at smartphones, the ranking is a little different according to NPD. Apple holds the top spot with 39 percent of the US smartphone market, while Samsung again sits at number two with 30 percent. Motorola manages to rank third with 7 percent, while HTC dropped to fourth with 6 percent. In the US smartphone market, LG is fifth with 6 percent. Note how the percentages aren’t all that different from overall mobile phone market share - for all intents and purposes, the smartphone market is the mobile phone market in the US going forward. Still, Samsung was the top mobile phone vendor overall for 2012, and Strategy Analytics expects Samsung to be back on top soon. “Samsung had been the number one mobile phone vendor in the US since 2008, and it will surely be keen to recapture that title in 2013 by launching improved new models such as the rumored Galaxy S4”. And while Apple is the top vendor overall among smartphones, its iOS platform is still second to the Android platform overall. Samsung is the largest vendor selling Android-based smartphones, but Motorola, HTC, LG, and others also sell Android devices, giving the platform a clear advantage over iOS both domestically and globally. Report 2: Reader’s Response (2013, Feb) I don’t actually believe the numbers for Samsung. Ever since the debacle in early 2011, when Lenovo called into question the numbers Samsung was touting for tablet shipments, stating that Samsung had only sold 20,000 of the 1.5 million tablets they shipped into the US the last quarter of 2010, Samsung (who had no response to Lenovo) has refused to supply quarterly sales numbers for smartphones or tablets. That’s an indication that their sales aren’t what analysts are saying. We can look to several things to help understand why. In the lawsuit between Apple and Samsung here last year, both were required to supply real sales numbers for devices under contention. The phones listed turned out to have sales between one third and one half of what had been guessed by IDC and others. Tablet sales were even worse. Of the 1.5 million tablets supposedly shipped to the US during that time, only 38,000 were sold. Then we have the usage numbers. Samsung tablets have only a 1.5% usage rate, where the iPad has over 90%. Not as much a difference with the phones but it’s still overwhelmingly in favor of iPhone. The problem is that with Apple’s sales, we have actual numbers to go by. The companies who estimate can calibrate what they do after those numbers come out. But with Samsung and many others, they can’t ever calibrate their methods, as there are no confirming numbers released from the firms. A few quarters ago, as a result, we saw iSupply estimate Samsung’s smartphone sales for the quarter at 32 million, with estimates from others all over the place up to 50 million. Each time some other company reported a higher number for that same quarter, the press dutifully used that higher number as THE ONE. But none of them was the one. Without accurate self-reporting of actual sales to the end users, none of these market share charts are worth a damn! Report 3: Contradictory survey (Feb, 2013) iPhone5 Ranks Fifth In U.S. Customer Satisfaction Survey inShare. The iPhone5 ranks fifth in customer satisfaction according to the results of a recent survey from OnDevice Research, a mobile device research group. In the poll, they asked 320,000 smartphone and tablet users from six different countries, how satisfied they were with their devices. According to 93,825 people from the US, Motorola Atrix HD is the most satisfying and Motorola’s Droid Razr took second spot. HTC Corp (TPE : 2498)’s Rezound 4G and Samsung Galaxy Note 2 took third and fourth spots, while Apple’s iPhone5 landed in fifth spot. It appears that Apple may be lagging in consumer interest. OnDevice Research, Sarah Quinn explained, “Although Apple created one of the most revolutionary devices of the past decade, other manufactures have caught up, with some Android powered devices now commanding higher levels of user satisfaction.” Despite the lower rankings, things aren’t looking too bad for Apple Inc. (NASDAQ:AAPL) elsewhere. In the United Kingdom, they ranked second place, right after HTC One X. Interesting enough, Apple did take top spot for overall satisfaction of mobile device, whereas Google Inc. (NASDAQ:GOOG) ranked second. Motorola Mobility Holdings Inc. (NYSE:NOK) took third, fourth, and fifth places respectively, while Sony Ericsson trailed behind at sixth place. The survey sampled mobile device users in the following countries: United States, United Kingdom, France, Germany, Japan, and Indonesia. Although OnDevice didn’t share the full list of devices mentioned in the survey, it does show some insight to what customers want. Unfortunately, there were still many questions regarding the survey that were left unanswered. Everyone wants to know why Google Inc. (NASDAQ:GOOG) was on the list when they are not an actual smartphone maker and why was Samsung Electronics Co., Ltd. (LON:BC94) on the bottom of the satisfaction list when the brand is leading elsewhere. Source: 92.825 US mobile users, July 2012 - January 2013 Fortunately, those questions were answered by OnDevice Research’s representative. He explained that the survey was conducted on mobile web where the survey software could detect the taker’s device and since user’s rate their satisfaction levels on a 1 to 10 scale, thanks to the Nexus device, Google was included.If you analyze the three reports above, which of the following statements would be the best inference?
 ....
MCQ-> Recently I spent several hours sitting under a tree in my garden with the social anthropologist William Ury, a Harvard University professor who specializes in the art of negotiation and wrote the bestselling book, Getting to Yes. He captivated me with his theory that tribalism protects people from their fear of rapid change. He explained that the pillars of tribalism that humans rely on for security would always counter any significant cultural or social change. In this way, he said, change is never allowed to happen too fast. Technology, for example, is a pillar of society. Ury believes that every time technology moves in a new or radical direction, another pillar such as religion or nationalism will grow stronger in effect, the traditional and familiar will assume greater importance to compensate for the new and untested. In this manner, human tribes avoid rapid change that leaves people insecure and frightened.But we have all heard that nothing is as permanent as change. Nothing is guaranteed. Pithy expressions, to be sure, but no more than cliches. As Ury says, people don’t live that way from day-to-day. On the contrary, they actively seek certainty and stability. They want to know they will be safe.Even so we scare ourselves constantly with the idea of change. An IBM CEO once said: ‘We only re-structure for a good reason, and if we haven’t re-structured in a while, that’s a good reason.’ We are scared that competitors, technology and the consumer will put us Out of business — so we have to change all the time just to stay alive. But if we asked our fathers and grandfathers, would they have said that they lived in a period of little change? Structure may not have changed much. It may just be the speed with which we do things.Change is over-rated, anyway, consider the automobile. It’s an especially valuable example, because the auto industry has spent tens of billions of dollars on research and product development in the last 100 years. Henry Ford’s first car had a metal chassis with an internal combustion, gasoline-powered engine, four wheels with rubber types, a foot operated clutch assembly and brake system, a steering wheel, and four seats, and it could safely do 1 8 miles per hour. A hundred years and tens of thousands of research hours later, we drive cars with a metal chassis with an internal combustion, gasoline-powered engine, four wheels with rubber tyres a foot operated clutch assembly and brake system, a steering wheel, four seats – and the average speed in London in 2001 was 17.5 miles per hour!That’s not a hell of a lot of return for the money. Ford evidently doesn’t have much to teach us about change. The fact that they’re still manufacturing cars is not proof that Ford Motor Co. is a sound organization, just proof that it takes very large companies to make cars in great quantities — making for an almost impregnable entry barrier.Fifty years after the development of the jet engine, planes are also little changed. They’ve grown bigger, wider and can carry more people. But those are incremental, largely cosmetic changes.Taken together, this lack of real change has come to man that in travel — whether driving or flying — time and technology have not combined to make things much better. The safety and design have of course accompanied the times and the new volume of cars and flights, but nothing of any significance has changed in the basic assumptions of the final product.At the same time, moving around in cars or aero-planes becomes less and less efficient all the time Not only has there been no great change, but also both forms of transport have deteriorated as more people clamour to use them. The same is true for telephones, which took over hundred years to become mobile or photographic film, which also required an entire century to change.The only explanation for this is anthropological. Once established in calcified organizations, humans do two things: sabotage changes that might render people dispensable, and ensure industry-wide emulation. In the 960s, German auto companies developed plans to scrap the entire combustion engine for an electrical design. (The same existed in the 1970s in Japan, and in the 1980s in France.) So for 40 years we might have been free of the wasteful and ludicrous dependence on fossil fuels. Why didn’t it go anywhere? Because auto executives understood pistons and carburettors, and would be loath to cannibalize their expertise, along with most of their factoriesAccording to the above passage, which of the following statements is true?
 ....
MCQ-> The multi-layered pie-chart below shows the sales of LED television sets for a big retail electronics outlet during 2016 and 2017. The outer layer shows the monthly sales during this period, with each label showing the month followed by sales figure of that month. For some months, the sales figures are not given in the chart. The middle-layer shows quarterwise aggregate sales figures (in some cases, aggregate quarter-wise sales numbers are not given next to the quarter). The innermost layer shows annual sales. It is known that the sales figures during the three months of the second quarter (April, May, June) of 2016 form an arithmetic progression, as do the three monthly sales figures in the fourth quarter (October, November, December) of that year. 
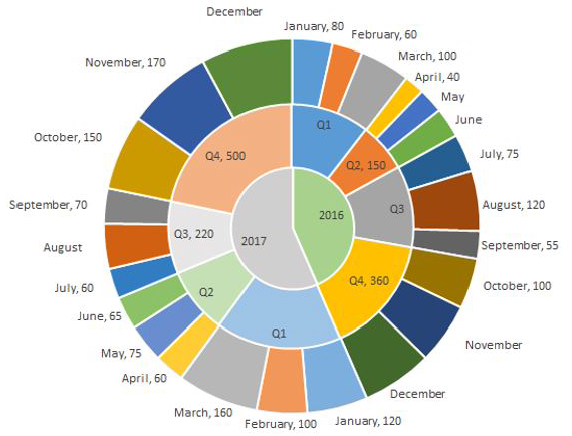
What is the percentage increase in sales in December 2017 as compared to the sales in December 2016?
 ....
Terms And Service:We do not guarantee the accuracy of available data ..We Provide Information On Public Data.. Please consult an expert before using this data for commercial or personal use
DMCA.com Protection Status Powered By:Omega Web Solutions
© 2002-2017 Omega Education PVT LTD...Privacy | Terms And Conditions