Toggle navigation
Home
Article Category
Question Papers
General Knowlege
Popular Pages
Multiple Choice Question in 049
Multiple Choice Question in
Multiple Choice Question in TRADES-INSTRUCTOR---GR-II---SMITHY---TECHNICAL-EDUCATION
Multiple Choice Question in -current-affairs-2016
Question Answer in ASSISTANT-PROFESSOR---COMPUTER-SCIENCE-AND-ENGINEERING---TECHNICAL-EDUCATION
Multiple Choice Question in ASSISTANT-PROFESSOR---COMPUTER-SCIENCE-AND-ENGINEERING---TECHNICAL-EDUCATION
Multiple Choice Question in english
Multiple Choice Question in abbreviations-abbreviations-m
Multiple Choice Question in SSC CHSL 7 March 2018 Morning Shift
Multiple Choice Question in 072/2016
Multiple Choice Question in 100/2016
Question Answer Bank
Multiple Choice Question Bank
Question Answer Category
Multiple Choice Question Category
Home
->
Multiple Choice Questions
1. Cost of goods sold divided by average inventory gives
(A): Operation Ratio
(B): P.Ratio
(C): Stock Turnover Ratio
(D): G.P.Ratio
Previous Question
Show Answer
Next Question
Add Tags
Report Error
Show Marks
Write Comment
Type in
(Press Ctrl+g to toggle between English and the chosen language)
Post reply
Comments
Tags
Show Similar Question And Answers
QA->An article is sold at Rs.4,If it is sold at a loss of 5%. What was the cost price?....
QA->The 1982 painting named Nafea Faa Ipoipo (When will You Marry) has recently been sold for $300 Million, making it the most expensive work of art ever sold. Who is the painter?....
QA->Ram sends 50 table fans to Rahim costing Rs300 per table fan, to be sold at 20% above cost price. Sales will be ………….....
QA->The cost of 2 tables and 8 chairs is Rs.400, the cost of a table is :....
QA->The prices of a table and a chair are in the ration 4:The cost of 2 tables and 8 chairs is Rs.400, the cost of a table is :....
MCQ-> Read the passage carefully and answer the questions given at the end of each passage:Turning the business involved more than segmenting and pulling out of retail. It also meant maximizing every strength we had in order to boost our profit margins. In re-examining the direct model, we realized that inventory management was not just core strength; it could be an incredible opportunity for us, and one that had not yet been discovered by any of our competitors. In Version 1.0 the direct model, we eliminated the reseller, thereby eliminating the mark-up and the cost of maintaining a store. In Version 1.1, we went one step further to reduce inventory inefficiencies. Traditionally, a long chain of partners was involved in getting a product to the customer. Let’s say you have a factory building a PC we’ll call model #4000. The system is then sent to the distributor, which sends it to the warehouse, which sends it to the dealer, who eventually pushes it on to the consumer by advertising, “I’ve got model #4000. Come and buy it.” If the consumer says, “But I want model #8000,” the dealer replies, “Sorry, I only have model #4000.” Meanwhile, the factory keeps building model #4000s and pushing the inventory into the channel. The result is a glut of model #4000s that nobody wants. Inevitably, someone ends up with too much inventory, and you see big price corrections. The retailer can’t sell it at the suggested retail price, so the manufacturer loses money on price protection (a practice common in our industry of compensating dealers for reductions in suggested selling price). Companies with long, multi-step distribution systems will often fill their distribution channels with products in an attempt to clear out older targets. This dangerous and inefficient practice is called “channel stuffing”. Worst of all, the customer ends up paying for it by purchasing systems that are already out of date Because we were building directly to fill our customers’ orders, we didn’t have finished goods inventory devaluing on a daily basis. Because we aligned our suppliers to deliver components as we used them, we were able to minimize raw material inventory. Reductions in component costs could be passed on to our customers quickly, which made them happier and improved our competitive advantage. It also allowed us to deliver the latest technology to our customers faster than our competitors. The direct model turns conventional manufacturing inside out. Conventional manufacturing, because your plant can’t keep going. But if you don’t know what you need to build because of dramatic changes in demand, you run the risk of ending up with terrific amounts of excess and obsolete inventory. That is not the goal. The concept behind the direct model has nothing to do with stockpiling and everything to do with information. The quality of your information is inversely proportional to the amount of assets required, in this case excess inventory. With less information about customer needs, you need massive amounts of inventory. So, if you have great information – that is, you know exactly what people want and how much - you need that much less inventory. Less inventory, of course, corresponds to less inventory depreciation. In the computer industry, component prices are always falling as suppliers introduce faster chips, bigger disk drives and modems with ever-greater bandwidth. Let’s say that Dell has six days of inventory. Compare that to an indirect competitor who has twenty-five days of inventory with another thirty in their distribution channel. That’s a difference of forty-nine days, and in forty-nine days, the cost of materials will decline about 6 percent. Then there’s the threat of getting stuck with obsolete inventory if you’re caught in a transition to a next- generation product, as we were with those memory chip in 1989. As the product approaches the end of its life, the manufacturer has to worry about whether it has too much in the channel and whether a competitor will dump products, destroying profit margins for everyone. This is a perpetual problem in the computer industry, but with the direct model, we have virtually eliminated it. We know when our customers are ready to move on technologically, and we can get out of the market before its most precarious time. We don’t have to subsidize our losses by charging higher prices for other products. And ultimately, our customer wins. Optimal inventory management really starts with the design process. You want to design the product so that the entire product supply chain, as well as the manufacturing process, is oriented not just for speed but for what we call velocity. Speed means being fast in the first place. Velocity means squeezing time out of every step in the process. Inventory velocity has become a passion for us. To achieve maximum velocity, you have to design your products in a way that covers the largest part of the market with the fewest number of parts. For example, you don’t need nine different disk drives when you can serve 98 percent of the market with only four. We also learned to take into account the variability of the lost cost and high cost components. Systems were reconfigured to allow for a greater variety of low-cost parts and a limited variety of expensive parts. The goal was to decrease the number of components to manage, which increased the velocity, which decreased the risk of inventory depreciation, which increased the overall health of our business system. We were also able to reduce inventory well below the levels anyone thought possible by constantly challenging and surprising ourselves with the result. We had our internal skeptics when we first started pushing for ever-lower levels of inventory. I remember the head of our procurement group telling me that this was like “flying low to the ground 300 knots.” He was worried that we wouldn’t see the trees.In 1993, we had $2.9 billion in sales and $220 million in inventory. Four years later, we posted $12.3 billion in sales and had inventory of $33 million. We’re now down to six days of inventory and we’re starting to measure it in hours instead of days. Once you reduce your inventory while maintaining your growth rate, a significant amount of risk comes from the transition from one generation of product to the next. Without traditional stockpiles of inventory, it is critical to precisely time the discontinuance of the older product line with the ramp-up in customer demand for the newer one. Since we were introducing new products all the time, it became imperative to avoid the huge drag effect from mistakes made during transitions. E&O; – short for “excess and obsolete” - became taboo at Dell. We would debate about whether our E&O; was 30 or 50 cent per PC. Since anything less than $20 per PC is not bad, when you’re down in the cents range, you’re approaching stellar performance.Find out the TRUE statement:
....
MCQ-> Based on the information answer the questions which follow.A consultant to Department of Commerce. Government of Bianca has suggested 30 products which have high export potential. Dora an entrepreneur and prospective exporter notices that these products can be grouped in three ways- Machine made goods, Handmade goods and Intermediate goods. Among these 30 products some products are both machine made and intermediate goods but not handmade goods. Few products have a combination of handmade and machine made goods but not intermediate goods. Some products are handmade and intermediate goods but not machine made goods. Further it is seen that handmade-machine made goods are I less than machine made-intermediate goods. Similarly the total number of handmade-intermediate goods is I less than machine made-intermediate goods. There are just 4 products common across all product groups i.e. machine made-handmade- intermediate goods. Apart from this the number of only handmade goods is same as only machine made goods but less than only intermediate goods. Each product group/combination has at least one product. Dora prefers to export machine made goods and avoid hand made goods. She finds out that only handmade goods are twice the machine made-intermediate goods and the number of only intermediate goods is an even number. Whereas her close friend Sara prefers to export intermediate goods followed by only handmade goods.Sara and Dora prefer to export as many common products as possible in order to understand the regulatory conditions. Keeping their preferences intact, what is the maximum number of common products which can be exported by both of them?
....
MCQ->
Analyse the following passage and provide appropriate answers for questions that follow.
For private goods, competitive markets ensure efficiency despite the decentralized nature of the informati on about individual’s tastes and firm technologies. Implicitly, market competition solved adverse selection problems and the fixed - price contracts associated with exogenous prices solve moral hazard problems. However, markets fail for pure public goods and public intervention is thus needed. In this case, the mechanisms used for those collective decisions must solve the incentive problem of acquiring the private information that agents have about their references for public goods. Voting mechanisms are particular incentive mechanisms without any monetary transfers for which the same question of strategic voting, i.e., not voting according to the true preferences, can be raised. For private goods, increasing returns to scale create a situation of natural monopoly far away from the world of competitive markets. When the monopoly has private information about its cost or demand, its regulation by a regulatory commission becomes a principal – agent problem. (Note: Public goods are those in which individuals cannot be excluded from use and where use by one individual does not reduce availability to others, while an individual can be excluded in case of private goods.)For which of the following goods, can markets not be efficient?
....
MCQ-> The first table gives the number of saris (of all the eight colours) stocked in six regional showrooms. The second gives the number of saris (of all the eight colours) sold in these six regional showrooms. The third table gives the percentage of saris sold to saris stocked for each colour in each region. The fourth table gives the percentage of saris of a specific colour sold within that region. The fifth table gives the percentage of saris of a specific colour sold across all the regions. Study the tables and for each of the following questions, choose the best alternative.Table 1
Table 2
Table 3
Table 4
Table 5
Which region-colour combination accounts for the highest percentage of sales to stock?
....
MCQ-> Abdul has 8 factories, with different capacities, producing boutique kurtas. In the production process, he incurs raw material cost, selling cost (for packaging and transportation) and labour cost. These costs per kurta vary across factories. In all these factories, a worker takes 2 hours to produce a kurta. Profit per kurta is calculated by deducting raw material cost, selling cost and labour cost from the selling price (Profit = selling price - raw materials cost - selling cost - labour cost). Any other cost can be ignored.
Which of the following options is in decreasing order of raw materials cost?
....
×
×
Type The Issue
×
Your Marks
Terms And Service:We do not guarantee the accuracy of available data ..We Provide Information On Public Data.. Please consult an expert before using this data for commercial or personal use
Powered By:Omega Web Solutions
© 2002-2017 Omega Education PVT LTD...
Privacy
|
Terms And Conditions
 Powered By:Omega Web Solutions
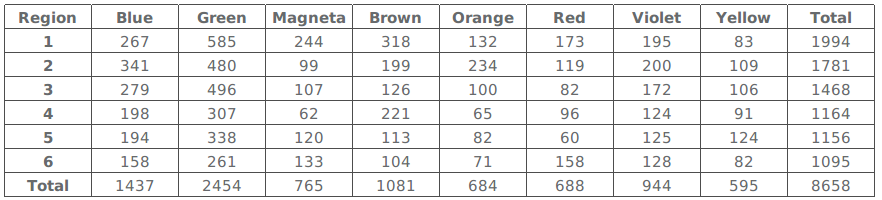 Table 2
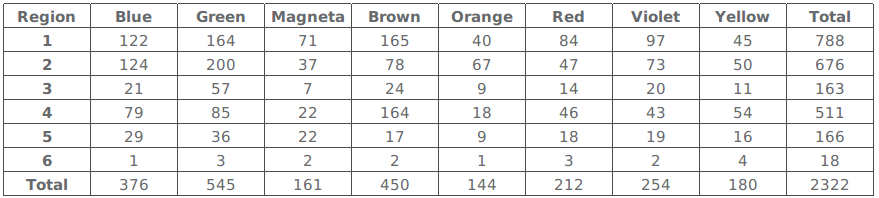 Table 3
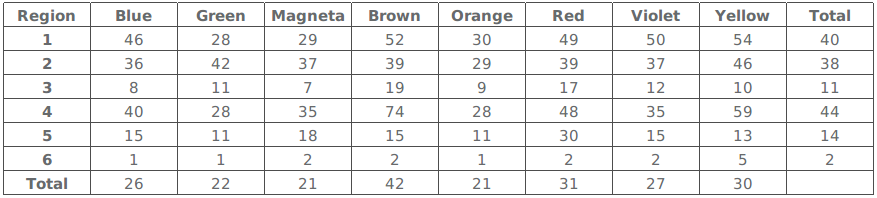 Table 4
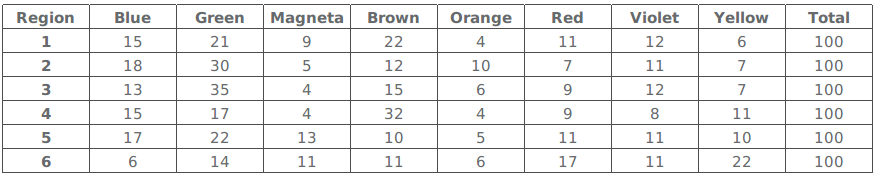 Table 5
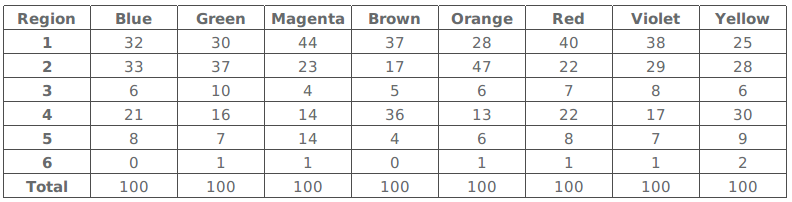 Which region-colour combination accounts for the highest percentage of sales to stock?
 Which of the following options is in decreasing order of raw materials cost?